vector
 vector copied to clipboard
Invalid rate for log to metric counter on Kubernetes
Problem
Log to metric counter component in transform doesn't work as expected when I increase the replica of vector deployment/statefulset in the Kubernetes cluster.
Describe the bug
The invalid rate (zero rate) for the log to metric counter after setting more than one replica.
and also the rate of this log to metric counter in transform with more than one replica doesn't match the rate of the vector_component_sent_events_total on the same logs with the same rate.
For the test, First, I produced sample logs with demo_logs that deployed as daemonsets in some clusters that send logs with interval 60 (1 log per minute) from each node to my main vector. Then in my main vector, I put a filter and log to the metric counter on that specific tag and check and compare the rate of vector_component_sent_events_total of filter component metric and the rate of log to metric counter component metric on that specific tag (same log with the same rate at the same time).
what I expected is that the rate of these two metrics should be 1 and also the same but when I increase the number of replicas of this main vector, the rate of the log to metric counter become invalid and sometimes give me zero rates but the rate of vector_component_sent_events_total is fine and correct.
I reproduced this issue with many sinks and sources (Kafka, s3, Loki, HTTP) on vector versions 0.20.0, 0.21.0, 0.22.0, etc But the problem persists example configurations of my main vector: fluentd [source] --> counter [transform] ---> [loki] kafka[source] --> counter[transform] --> [loki|console|aws_s3|...] And also I Add an additional label that is specific to the Vector instance but the problem still persists.
Configuration (my main vector)
transforms:

      filter_test:
        type: filter
        inputs:
          - to_json
        condition: .tag == "my_tag" && .cluster == "my_cluster" && .node == "my_node"


      tag_counter_metrics:
        type: "log_to_metric"
        inputs:
          - to_json
        metrics:
          - type: counter
            name: tag_total
            field: tag
            namespace: vlg
            tags:
              host: "${HOSTNAME}"
              tag: "{{mytag}}"
              node: "{{mynode}}"
              cluster: "{{mycluster}}"
Version
0.22.3
Example Data (my main vector)
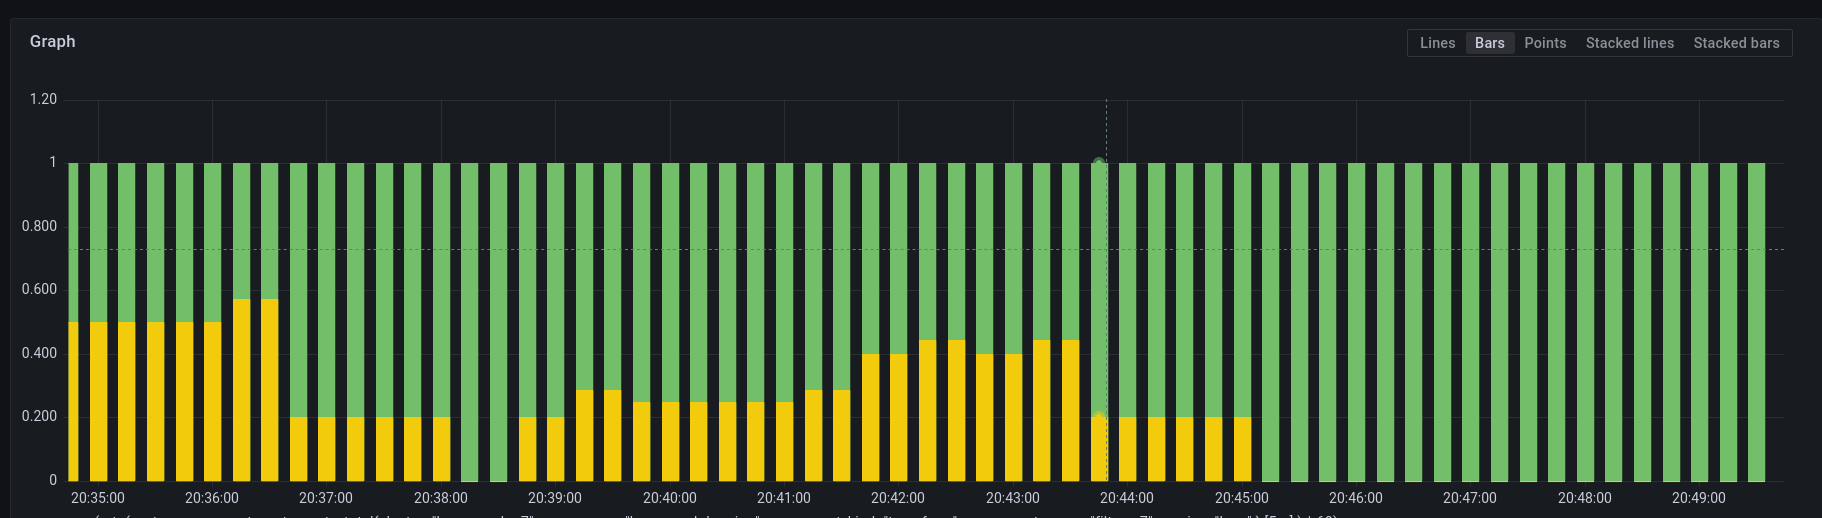
My main vector pipeline replica ---> 3
The yellow ---> sum(rate(vlg_tag_totall{component_name="log_to_metric_counter"}[5m])*60) invalid
The green --> sum(rate(vector_component_sent_events_total{component_name="filter_component"}[5m])*60) valid
Additional Context
similar to https://github.com/vectordotdev/vector/discussions/12914
References
No response
Hi @Mhmdrezahadi . did you face the same issue? at this moment, no, I have not found a solution here. the problem still persists in my Kubernetes environment.
@LinTechSo I think part of the problem here is a misunderstanding between metric tags and Loki labels.
As @jszwedko pointed out in the discussion, you're setting a single label on the events emitted by the loki sink, which is leading to your issue of the rate not appearing correctly as multiple replicas are fighting to update the value in a single stream.
The loki sink does not implicitly use all tags on a metric as its set of labels, but instead requires you to explicitly specify the labels via the labels setting. These labels, as you've discovered, can be templated which would allow you to simply use the value from the existing metric tags you've added in your log_to_metric transform... but you have to add them to labels, they aren't used automatically.
@tobz i reproduced this issue with console and Minio/Elasticsearch sinks as well and nothing changed. i think this problem related to only transform: log_to_metric component and doesn't matter what the source and sink is.
@tobz i reproduced this issue with console and Minio/Elasticsearch sinks as well and nothing changed. i think this problem related to only transform: log_to_metric component and doesn't matter what the source and sink is.
@LinTechSo When you "reproduced the issue with [the] console [sink]", what are you actually seeing? It does no aggregation/mutation of events, and likewise, log_to_metric simply emits metrics from logs and does no other aggregation/mutation, so almost by definition, the console sink can't be wrong here, because it's just turning the metric as-is into a string and writing it out.
Hi @tobz. thanks for the info. I reproduced the issue with [the] Loki [sink] with the same labels in transform.log_to_metric tags.
This is my full configuration:
sources:
  internal_metrics:
    type: internal_metrics

  kafka_test:
    type: kafka
    bootstrap_servers: kafka:9092
    group_id: my_loki
    topics:
      - my_loki

transforms:
  to_json:
    type: remap
    inputs:
      - kafka_test
    source: |
        . = parse_json!(.message)


  filter_test:
    type: filter
    inputs:
      - to_json
    condition: .tag == "my_tag" && .cluster == "my_cluster" && .node_name == "my_node"

  tag_counter_metrics:
    type: "log_to_metric"
    inputs:
      - filter_test
    metrics:
      - type: counter
        name: tag_total
        field: tag
        namespace: vl
        tags:
	  tag: "{{tag}}"
	  cluster: "{{cluster_name}}"
	  namespace: "{{pod_namespace}}"
	  pod: "{{pod_name}}"
	  container: "{{container_name}}"
	  node: "{{node_name}}"

sinks:
  prometheus_exporter:
    type: prometheus_exporter
    inputs:
      - internal_metrics
      - tag_counter_metrics
    address: 0.0.0.0:9598
    default_namespace: service

  loki_sink:
    type: loki
    inputs:
      - filter_test
    endpoint: http://loki:3100
    acknowledgements: true
    out_of_order_action: accept
    labels:
      tag: "{{tag}}"
      cluster: "{{cluster_name}}"
      namespace: "{{pod_namespace}}"
      pod: "{{pod_name}}"
      container: "{{container_name}}"
      node: "{{node_name}}"
    batch:
      max_bytes: 1024000
    buffer:
      type: memory
      max_events: 5000
      when_full: block
    tenant_id: "test"
    remove_timestamp: false
    encoding:
      codec: json
But the result is the same as before version 0.24.0.
and also if I understand correctly by definition, the console [sink] can't be wrong because it does no aggregation/mutation of events but when I reproduced this issue with [the] console [sink] again in version 0.24.0 the problem still persisted.
and this is my configuration with console [sink]
  filter_generator:
    type: filter
    inputs:
      - to_json
    condition:
      type: vrl
      source: .tag == "my_tag" && .cluster == "my_cluster" && .node_name == "my_node"

  tag_counter_metrics:
    type: "log_to_metric"
    inputs:
      - filter_generator
    metrics:
      - type: counter
        name: tag_total
        field: tag
        namespace: vl
        tags:
          tag: "{{tag}}"
          node: "{{node_name}}"
          cluster: "{{cluster}}"

sinks:
  prometheus_exporter:
    type: prometheus_exporter
    inputs:
      - internal_metrics
      - tag_counter_metrics
    address: 0.0.0.0:9598
    default_namespace: service

  console_all:
    type: console
    inputs:
      - filter_generator
    target: stdout
    encoding:
      codec: json
the result is the same as above and metrics show me a zero rate in some points.
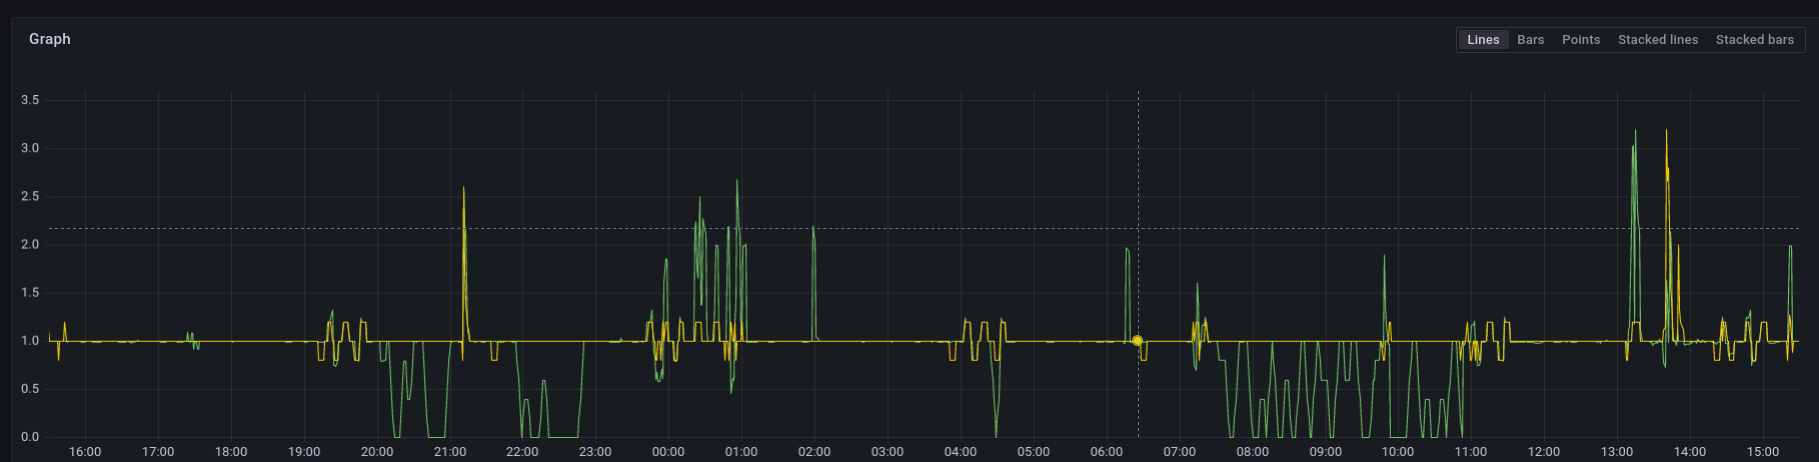 screenshot of 24 hours of these two metrics with console [sink] !
yellow: rate of
screenshot of 24 hours of these two metrics with console [sink] !
yellow: rate of vector_component_sent_events_total{component_name="filter_generator"} counter (correct)
green: rate of log_to_metric_counter{component_name="tag_counter_metrics"} (incorrect)
with the above configuration and vector version 0.24.0
I would appreciate any advice and/or updates
👋 hi @LinTechSo ,
A few questions to help move this forward:
-
Are you only seeing this with multiple replicas? (for example, does it reproduce outside of k8s)
-
Are there any warnings or errors being emitted by Vector?
One test to do would be to use the console sink or file sink to collect the events output from the filter_generator transform, and compare that value to the vector_component_sent_events_total{component_name="filter_generator"}
Hi @neuronull, thanks for the reply.
- Didn't test this out of the k8s. however, I think this issue happened in heavy-load environments
- No error or warning
vector version 0.28.0
for example my test:
Assume that I deployed daemonset vector pods in some clusters, these vector pods have a demo_logs source with a time interval of 60 (which means 1 log per minute )
this 1 log/min request comes to my main vector.
then my main vector uses the console sink and has a tag_to_metric counter on my demo logs that already have a tag field
the problem : when I increase the number of replicas, the rate on my logs become invalid on this counter (zero in some case)
The rate of this counter must be 1 log/min forever...
I have an update about this issue.
I found that this issue happened because of my misunderstanding
The reason of this invalid rate comes from Prometheus exporter flush_period_secs Configuration that doesn't matches the vector instances for this low input event rate
In above scenario, Suppose that we send 1 log per minutes to 2 vector instances (2 replica).
The log_to_metrics counter would have invalid rate until we increases the flush_period_secs to 120s
I think for fix this issue, we should increase flush_period_secs or increase the rate of the log generator intervals
to capture the right rate for fixed log generator rate
i close this issue, but i appreciate that if you help me exactly figure this out if i am wrong.
thanks