[Question] Advanced settings for dummies
Hey! Can you please explain in some details each of the Indexing and Caching settings, more from a practical standpoint, and what are the optimal settings for various typical usecases?
For example, right now I want to optimize search speed in non-updating 1-20 GB txt files for fairly simple regex queries. But I'm on a pretty subpar laptop i5-8250U with 8GB of RAM (is there a way to make more use of RAM?)
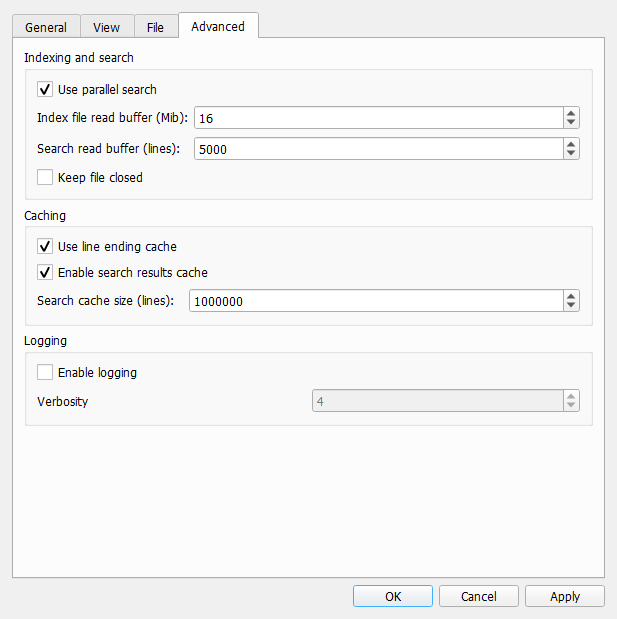
Index file read buffer is controlling the size of chunks of data that are read from disk at once during initial file loading. The idea is to balance disk read and cpu performance. In the ideal case building index from one chunk of data takes about the same time as reading next chunk of data from disk. That way as soon as one chunk has been processed, the next one is available. The best value for read buffer size depends on both disk performance and CPU/memory performance. It can be determined only by experiments.
Search read buffer is controlling the size of chunks of data that are passed to regular expression matching engine. The idea is basically the same. Klogg uses multi-threading to do the search. It creates a thread per cpu core. Ideally each thread always has something to do, and amount of work per thread is significant. If this search read buffer is too low, more time is spent on thread synchronization. If this number is too high then disk io may become an issue. Also the higher this number is the more memory will be used as this buffer is allocated for each regex matching thread.
In "average" case I suggest leaving index file read buffer by default. Search read buffer can be increased to 10000-50000 lines.
Also you can try recent development builds. I use klogg every day and these builds are generally stable. In these builds regular expression search is 2-3 times faster. This performance increase can't be achieved by tuning advanced settings.
The best value for read buffer size depends on both disk performance and CPU/memory performance. It can be determined only by experiments.
May be a test feature can be done to decide the value and give a suggestion. If user can give a typical usage of file and search pattern, and program can try to add/sub the buffer size by it self to sea better performance on which point. Or it can known on which size disk or cpu/memory could be a performance bottleneck. Of course, it worth to do or not depends on how many performance gain we can get. From your explanation, I think there may be some different between user use HDD or SSD, or some user may have very powerful computer or large memory.
This can be taken even further. Buffer sizes can be changed dynamically in runtime to account for current workstation capabilities and load. Something like TCP window size selection algorithms do. Need to think about correct metrics though.
It sounds like we can have two buffers to interleave to load data from disk?
I prefer not to add any more complexity to file reading and searching right now. Initial file loading in my environment is already limited by my SSD IO performance, so it would be hard to measure improvements. And after adding fast path for ascii, utf8 and utf16le encodings search for simple regex for that cases is also close to my ssd IO limits.
It sounds like we can have two buffers to interleave to load data from disk?
Right now during initial file loading klogg has a queue of data blocks. The total size of all blocks in that queue is limited by the index read buffer size settings. Index building code takes blocks from the head of the queue, and as soon as the queue size in less than the limit, next block is read from disk. All block reading is done in a single separate thread.
Search read buffer is controlling the size of chunks of data that are passed to regular expression matching engine. The idea is basically the same. Klogg uses multi-threading to do the search. It creates a thread per cpu core. Ideally each thread always has something to do, and amount of work per thread is significant. If this search read buffer is too low, more time is spent on thread synchronization. If this number is too high then disk io may become an issue. Also the higher this number is the more memory will be used as this buffer is allocated for each regex matching thread.
Does hitting the disk io bottleneck slow the search compared to the same search with lower ('optimal') read buffer? How much can you really hurt by setting it too high?
Here's what I've set, does it look unreasonable?
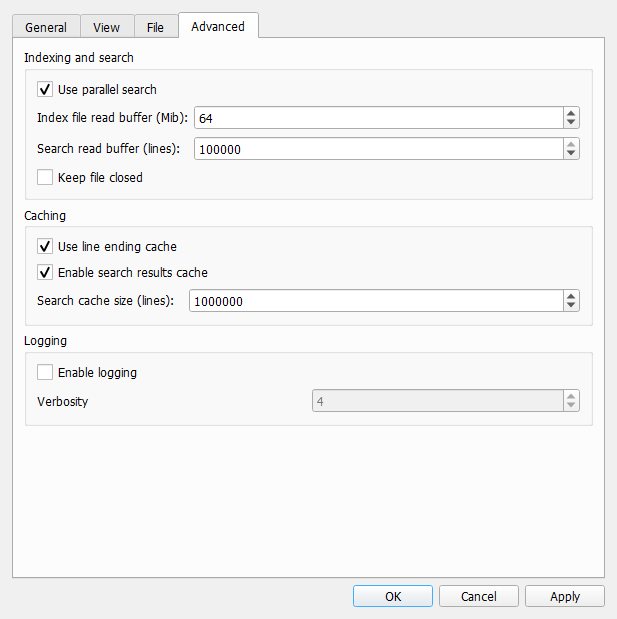
Like I've said, I'm on a fairly slow machine, so for me CPU is the real bottleneck. SSD is far from being maxed. But this makes me wonder if it's possible that I'm wasting some RAM for no performance gain this way?
The best value for read buffer size depends on both disk performance and CPU/memory performance. It can be determined only by experiments.
May be a test feature can be done to decide the value and give a suggestion. If user can give a typical usage of file and search pattern, and program can try to add/sub the buffer size by it self to sea better performance on which point. Or it can known on which size disk or cpu/memory could be a performance bottleneck. Of course, it worth to do or not depends on how many performance gain we can get. From your explanation, I think there may be some different between user use HDD or SSD, or some user may have very powerful computer or large memory.
Yeah, we need to understand how much of a difference tweaking the defaults will make on a balanced system first. So we don't end up implementing a complex feature that calculates optimal values only to realize for most users defaults work just fine 😅 Love how I keep saying 'we' as if I have anything to do with it.
On the other hand, it doesn't have to be perfect or even good to be useful for the cases where it actually can make a significant difference. If you don't have time to work on an automatic buffer size tweaker, I would suggest an iterative approach to this feature:
- A short explanation of how those values are connected to potential CPU/SSD bottlenecks and RAM usage, and some general tips about optimizing the values in the docs. Just focusing on most practical applications, without getting into too much theory behind it.
- (optional) A UI tip/warning can be shown if user tries to input values that potentially can degrade the performance.
- A test that analyzes the system specs & capabilities to suggest optimal values for the user. This will require additional research into usage patterns and more testing on different machines.
And if it turns out to have significant effect on the average performance, a dynamic system that you describe would be a really cool feature to have!
This can be taken even further. Buffer sizes can be changed dynamically in runtime to account for current workstation capabilities and load. Something like TCP window size selection algorithms do. Need to think about correct metrics though.
Love how I keep saying 'we' as if I have anything to do with it.
This whole thing sounds like a good research project :)
Like I've said, I'm on a fairly slow machine, so for me CPU is the real bottleneck. SSD is far from being maxed.
Version 20.12 uses Qt regex engine. That is very slow, so CPU becomes a bottleneck for search.
Here are some measurements from my machine. Test file is around 900Mb. It is using the UTF8 encoding. For 20.12 encoding does not matter, but current dev version has some fast-paths for UTF8/UTF16LE inputs (for other encodings it is about 2 times slower that for UTF8).
/dev/sda: Model=Samsung SSD 850 EVO M.2 500GB Timing cached reads: 19246 MB in 1.99 seconds = 9671.55 MB/sec Timing buffered disk reads: 1228 MB in 3.00 seconds = 409.16 MB/sec
cpuinfo: model name : Intel(R) Core(TM) i5-6300HQ CPU @ 2.30GHz flags : fpu vme de pse tsc msr pae mce cx8 apic sep mtrr pge mca cmov pat pse36 clflush dts acpi mmx fxsr sse sse2 ss ht tm pbe syscall nx pdpe1gb rdtscp lm constant_tsc art arch_perfmon pebs bts rep_good nopl xtopology nonstop_tsc cpuid aperfmperf pni pclmulqdq dtes64 monitor ds_cpl vmx est tm2 ssse3 sdbg fma cx16 xtpr pdcm pcid sse4_1 sse4_2 x2apic movbe popcnt tsc_deadline_timer aes xsave avx f16c rdrand lahf_lm abm 3dnowprefetch cpuid_fault epb invpcid_single ssbd ibrs ibpb stibp tpr_shadow vnmi flexpriority ept vpid ept_ad fsgsbase tsc_adjust bmi1 hle avx2 smep bmi2 erms invpcid rtm mpx rdseed adx smap clflushopt intel_pt xsaveopt xsavec xgetbv1 xsaves dtherm arat pln pts hwp hwp_notify hwp_act_window hwp_epp md_clear flush_l1d
So my CPU supports sse4 and avx2 instructions. Minimum klogg requirements are sse2 and ssse3, but performance will be reduced. Also worth noting that packages on github are build with -march=x86-64 -mtune=generic to be compatible with most cpus. Dev-builds use -march=native.
Indexing
First the case, where file is already in OS cache:
| Klogg version | Index buffer, Mb | Indexing time, ms, | IO time, ms | Indexing perf, MiB/s |
|---|---|---|---|---|
| 20.12.0.813 | 1 | 1345 | 6 | 668 |
| 20.12.0.813 | 4 | 835 | 130 | 1076 |
| 20.12.0.813 | 16 | 830 | 390 | 1082 |
| 20.12.0.813 | 64 | 822 | 130 | 1093 |
| 21.08.0.1113 | 1 | 1227 | 210 | 731 |
| 21.08.0.1113 | 4 | 615 | 223 | 1460 |
| 21.08.0.1113 | 16 | 604 | 210 | 1485 |
| 21.08.0.1113 | 64 | 602 | 233 | 1490 |
It looks like increasing indexing buffer to more than 4Mb does not give that much performance. Indexing gets bound by CPU.
No the case for "cold" loading of file for 20.12.0.813:
| Index buffer, Mb | Indexing time, ms, | IO time, ms | Indexing perf, MiB/s |
|---|---|---|---|
| 1 | 3259 | 2581 | 275 |
| 4 | 2762 | 2116 | 325 |
| 16 | 2115 | 1463 | 424 |
| 64 | 2093 | 1444 | 429 |
Here increasing buffer to 16Mb gives the best results, and IO is the bottleneck. "Cold" loading of file for 21.08.0.1113 is the same as in 20.12.
Searching
After indexing is done, file should be in OS cache. In all cases I am searching for a simple string "m_currentPunter 0".
| Klogg version | Search line buffer | Searching time, ms, | Line reading time, ms | Matching time, ms | Search perf, lines/s |
|---|---|---|---|---|---|
| 20.12.0.813 | 1000 | 3264 | 2713 | 2862 | 2788136 |
| 20.12.0.813 | 10000 | 3210 | 2765 | 2958 | 2835027 |
| 20.12.0.813 | 50000 | 3095 | 2763 | 2866 | 2939733 |
| 20.12.0.813 | 100000 | 2969 | 2604 | 2717 | 3065271 |
| 21.08.0.1113 | 1000 | 607 | 560 | 262 | 14993114 |
| 21.08.0.1113 | 10000 | 584 | 537 | 267 | 15583597 |
| 21.08.0.1113 | 50000 | 747 | 716 | 263 | 12183160 |
| 21.08.0.1113 | 100000 | 686 | 657 | 269 | 13266502 |
Looks like for 20.12 search line buffer does not matter that much. For 21.08 there is a good spot somewhere between 10k and 50k lines, after that search performance goes down.
For current dev-versions searching for simple patterns takes about the same time as indexing. On my machine when file is in OS cache both are capped at around 1500 Mib/s. CPU is a bottleneck, so there is certainly some room for improvement. However, tuning advanced indexing and search buffer parameters do not give that much performance difference. For my machine defaults seem to be sane.