ng2-charts
 ng2-charts copied to clipboard
Setting the backgroundColor of a datapoint when using a custom chart type
Can custom chart types override the colors array?
I am using https://github.com/kurkle/chartjs-chart-matrix to get a custom matrix chart. From what I can see in your example, to make custom charts work you have to provide a colors array like in the Financial Chart example. This works fine.
But, when you do that the backgroundColor property of the dataset is ignored. For example, if you are trying to calculate a color for an individual node based off its value, you should be able to pass a function to backgroundColor, correct? This isn't working for me though. I added a console.log('hit') to the backgroundColor function and it is never run.
Am I misunderstanding how this work, or is the problem in the custom chart I am using?
 this.datasets = [{
      label: 'My Matrix',
      data: this.getData(),
      borderWidth: 1,
      hoverBorderColor: 'yellow', // hover color does work
      backgroundColor: (ctx) => { // this does not. It doesn't work as a function, or even if I do something like 'green' or '#0000ff'
        console.log('hit');
        let value = (ctx.dataset.data[ctx.dataIndex] as any).v;
        let color: ChartColor = this.generateColor(value);
        return color;
      }
    }];
Here is an example. If the backgroundColor from the dataset was used then the color would not be grey. https://stackblitz.com/edit/angular-ivy-crs44u?file=src/app/app.component.ts
backgroundColor on a dataset is not working for me either.
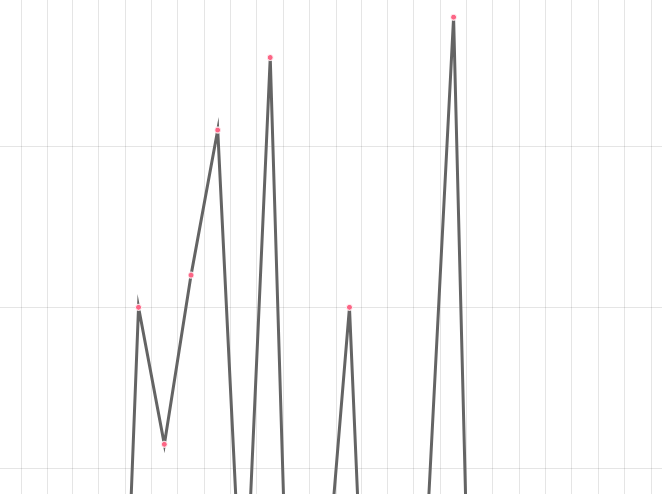
    this.chartData = [{
      type: 'line',
      data: data,
      backgroundColor: 'rgb(100, 100, 100)',  // no effect, shows default pink
      borderColor: 'rgb(100, 100, 100)',
      label: 'Observations'
    }]
The color property used depends on the dataset type. Check the custom chart type docs to understand if they implement the scriptability of all the options. For the line chart, the line color uses borderColor.