Adding two series to a timeline chart does not work
Description
Adding two series to a timeline charts only renders one of them
Seems like charts overwrites the timeline-line below the chart with the second series.

Expected outcome
Two lines are rendered
Actual outcome
One line is rendered and the second series causes the first line to be incorrectly rendered in the timeline at the bottom
Minimal reproducible example
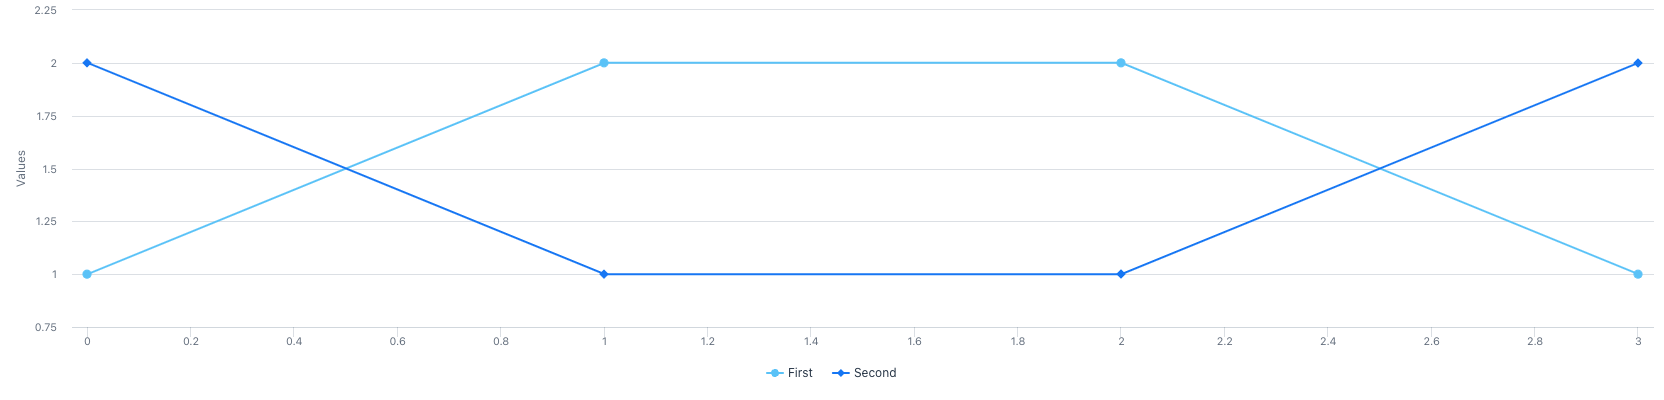
    <vaadin-chart timeline>
     <vaadin-chart-series title="First" .values=${[1, 2, 2, 1]}></vaadin-chart-series>
     <vaadin-chart-series title="Second" .values=${[2, 1, 1, 2]}></vaadin-chart-series>

    </vaadin-chart>
Steps to reproduce
Render it
Environment
- Version of the webcomponent / Vaadin platform. 23.0.1
The problem seems to be related to how the chart component obtains series from the chart-series component. Everything works fine when setting the series with the updateConfiguration() method:
<vaadin-chart timeline></vaadin-chart>

<script type="module">
const chart = document.querySelector('vaadin-chart');
chart.updateConfiguration({
  plotOptions: {
    series: {
        showInNavigator: true
    }
  },
  series: [
    { name: 'First', data: [1, 2, 3, 4] },
    { name: 'Second', data: [2, 1, 4, 3] }
  ]
});
</script>
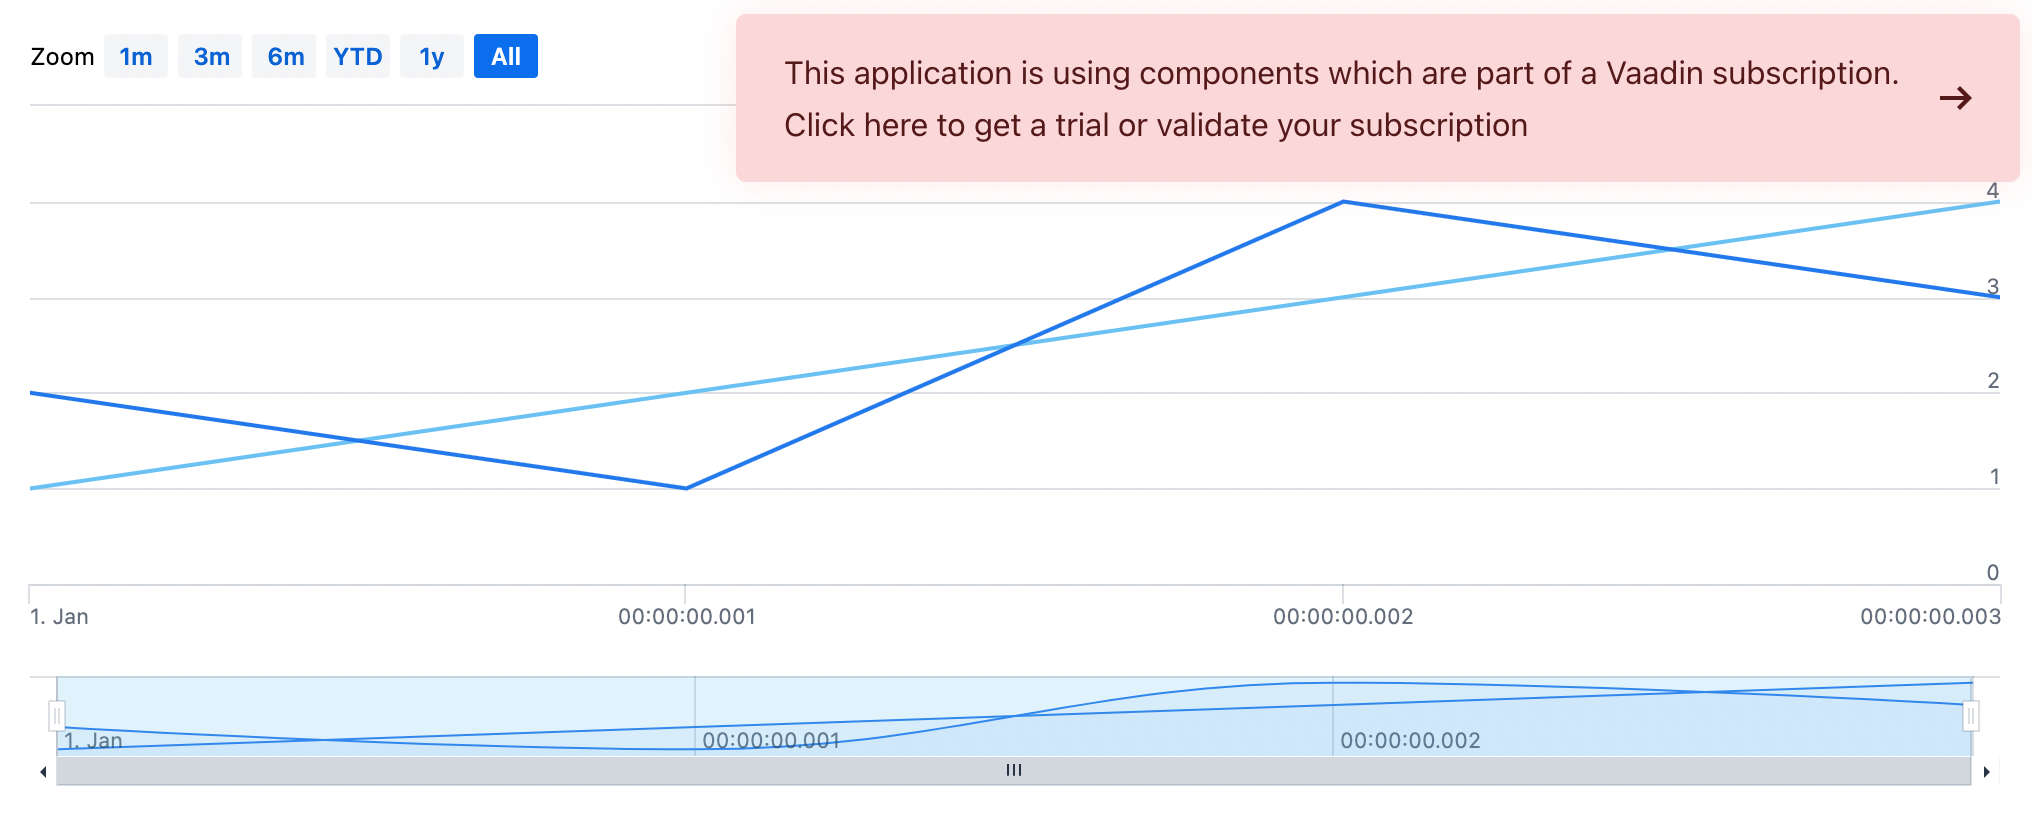
As soon as the first timeline series is added to the chart, HighCharts automatically adds a special AreaSplineSeries, which is needed for the timeline navigation bar:

The presence of that series has to be taken into account when calculating series idx here:
https://github.com/vaadin/web-components/blob/bf60fed4dc57c209b4273173f3e5f8260ead8372/packages/charts/src/vaadin-chart.js#L971-L991