ohlc
 ohlc copied to clipboard
open-high-low-close types and tools
![]()
Ohlc: Types + Tools for Open-High-Low-Close Values
Ohlc provides Ohlc, a namedtuple for storing and efficiently processing
open-high-low-close data, used for financial charts and calculations.
It also provides tools for processing, generating, and visualizing lists of Ohlc
values in the console.
Installation
pip install ohlc
Using the Data Type
from ohlc import Ohlc

o = Ohlc.from_values([2,5,4,7,11,7,2,9,5])  # Ohlc(open=2, high=11, low=2, close=5)
o.spread()                                  # 9
o = Ohlc(3,4,1,2)                           # Ohlc(open=3, high=4, low=1, close=2)
o == (3,4,1,2)                              # True -- Yeay! It is a regular tuple!

o1 = Ohlc.from_values(range(5,15))              # Ohlc(open=5, high=14, low=5, close=14)
o2 = Ohlc.from_values(range(14,3,-1), prev=o1)  # Ohlc(open=14, high=14, low=4, close=4)
o3 = Ohlc.from_values(range(5,20),    prev=o2)  # Ohlc(open=5, high=19, low=5, close=19)

o3.heikin()                                 # compute Heikin-Ashi candle from Ohlc chain
                                            # Ohlc(open=9.0, high=19, low=5, close=12.0)
Formatting Values
for o in [o1,o2,o3]: print(o.format())  # 5.000000 14.000000 5.000000 14.000000
                                        # 14.000000 14.000000 4.000000 4.000000
                                        # 5.000000 19.000000 5.000000 19.000000

print(o.format(sep=','))                # 5.000000,19.000000,5.000000,19.000000
print(o.format(sep='', fmt='{:d}\n'))   # 5
                                        # 19
                                        # 5
                                        # 19
Transformation + Aggregation
o1                                      # Ohlc(open=5, high=14, low=5, close=14)
o1.transform(scale=1.25, offset=1)      # Ohlc(open=7.5, high=18.75, low=7.5, close=18.75)]

agg = o.from_ohlc_list([o1,o2,o3])      # Ohlc(open=5, high=19, low=4, close=19)
Ohlc Plotting
For plotting, the class ohlc.candles.CandleCanvas provides raw colored console output
using terminal colors, but also supports styled output for embedding in
Urwid console apps.
A simpe plotter powered by Urwid + Widdy widgets
can be started using the provided ohlc command.
    # start the ohlc candlestick visualization using random values, heikin-ashi candles,
    # price action bars (colors), and the chart title: 'Candles'
    ohlc --pab --ha --random --title 'Candles'
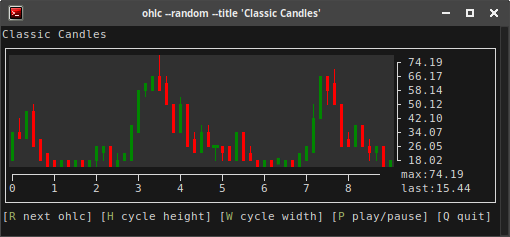
Omitting most options produces classic candle stick charts.
ohlc --random --title 'Classic Candles'
When plotting in interactive mode do not use /dev/stdin (this is already used by Urwid).
Use a file or file descriptor as the positional input argument to ohlc.
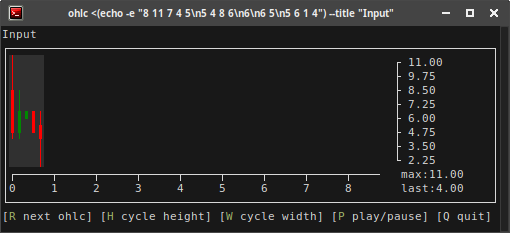
	 # plot some input data
    ohlc <(echo -e "8 11 7 4 5\n5 4 8 6\n6\n6 5\n5 6 1 4") --title "Input"
Non-Interactive Mode
There is also a non-interactive mode using the option -n or --non-interactive
that just reads the input to the end plots the end of the input stream using the
given or available screen width. This mode also supports /dev/stdin as input.
echo -e "8 11 7 4 5\n5 4 8 6\n6\n6 5\n5 6 1 4" | ohlc -n --title "Input" -W 23 -H 8
# ┌─────────────────────┐
# ││        ┌ 11.00     │
# │╽╷       ├ 8.50      │
# │┃┃╹┃╽    ├ 6.00      │
# │╵╵  ╿    └ 3.50      │
# │┌─────┐   max:11.00  │
# │0     1   last:4.00  │
# └─────────────────────┘
Tools
The command ohlc-input computes an Ohlc tuple for each input line and pipes out the four values.
ohlc-input <(echo 2 3 4 3 4; echo 4 5 6 8 9; echo 10 8 7 6)
# 2.000000 4.000000 2.000000 4.000000
# 4.000000 9.000000 4.000000 9.000000
# 10.000000 10.000000 6.000000 6.000000
The command ohlc-random generates and prints random Ohlc values.
ohlc-random --data_rate 1
# 0.100000 0.100000 0.073059 0.076472
# 0.076472 0.106526 0.073043 0.104767
# 0.104767 0.146023 0.098335 0.142284
# 0.142284 0.169882 0.118809 0.162817
# 0.162817 0.164071 0.131635 0.140002
# 0.140002 0.140246 0.111727 0.124778
Development
First fork and clone the repo. Then run the tests.
make # clean up and run all tests
You may need to install some tools and modules, i.e., flake8, pytest, twine, urwid,
and maybe others until all tests run through (see requirements.txt)
For packaging and local distribution you can build a Python wheel.
make build # build Python wheel
Packaging
Advanced packaging is only required from project maintainers. For packaging the project for PyPi, please see setup.mk.
Pull requests are welcome!
Change Log
- 2018: inital PoC and experiments + Py2 Py3 backport magic
- 2019-05-04: removed Python2 support and makepy dependency, added non-interactive mode
- 2023-10-13: updated scripts and fixed broken refresh on MacOS
Project Status
The project is in low maintenance mode. Do not use it in production. I use it only for personal prototypes and to demo the power of terminal apps.
Open Issues (by priority)
- project: cleanup upstream dependencies (widdy) and make them optional if possible (urwid)
- project: move custom argparse to separate package
- project: add Pypi flags
- bug: try detect unicode support and fallback to ASCII (e.g., in default iTerm2 on OSX)
- example: BTC Ticker or Custom Symbol Ticker
- usability: react on urwid resizing events
- musthave: add or allow adding
datetimetoOhlctuples - project: add CI/CD
- feature: draw correct time axis
- feature: set candle interval (5m 15m 30m 1h 4h, 6h, 1d, 3d, 1w, 1M, etc.)
- feature: add axis labels
- feature: support for bright color scheme
- feature: scrolling over all cached data
- feature: interactively shrink/grow the canvas (adjust top/bottom padding)
- feature: allow setting the cache size
- feature: allow seeking over input files
- feature: monitor CPU usage and reduce redraw (big + fast charts are still very expensive)
- example: Iteractive Ticker
- example: MultiChart App
- example: MultiChart Tickers
- example: Interactive MultiChart Tickers
- feature: indiator overlays (RSI, EMA12, EMA26, etc.)
- feature: indicators bars below chart (price action colored volume bars)