manifold
 manifold copied to clipboard
Published
20 hours ago •
 uber
uber
Visualization improvement for heatmaps in geo-spatial features
Currently we have 2 ways to show numerical values over spatially distributed data:
-
Overlapping heatmaps, used for displaying two data slices on a map:
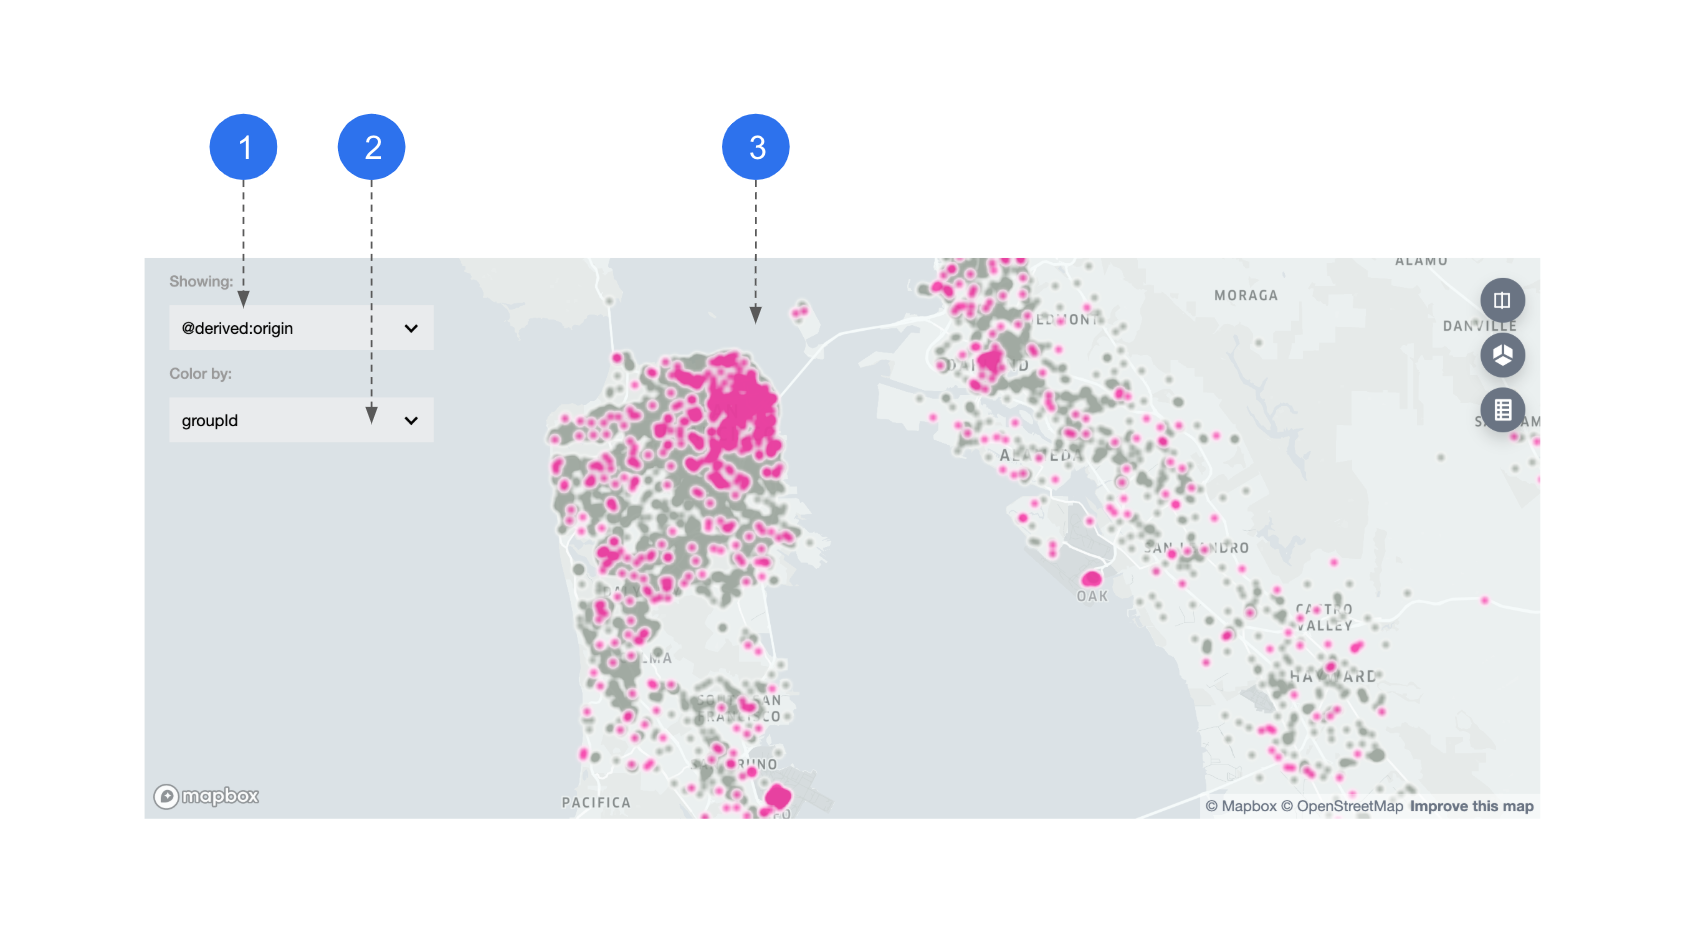
-
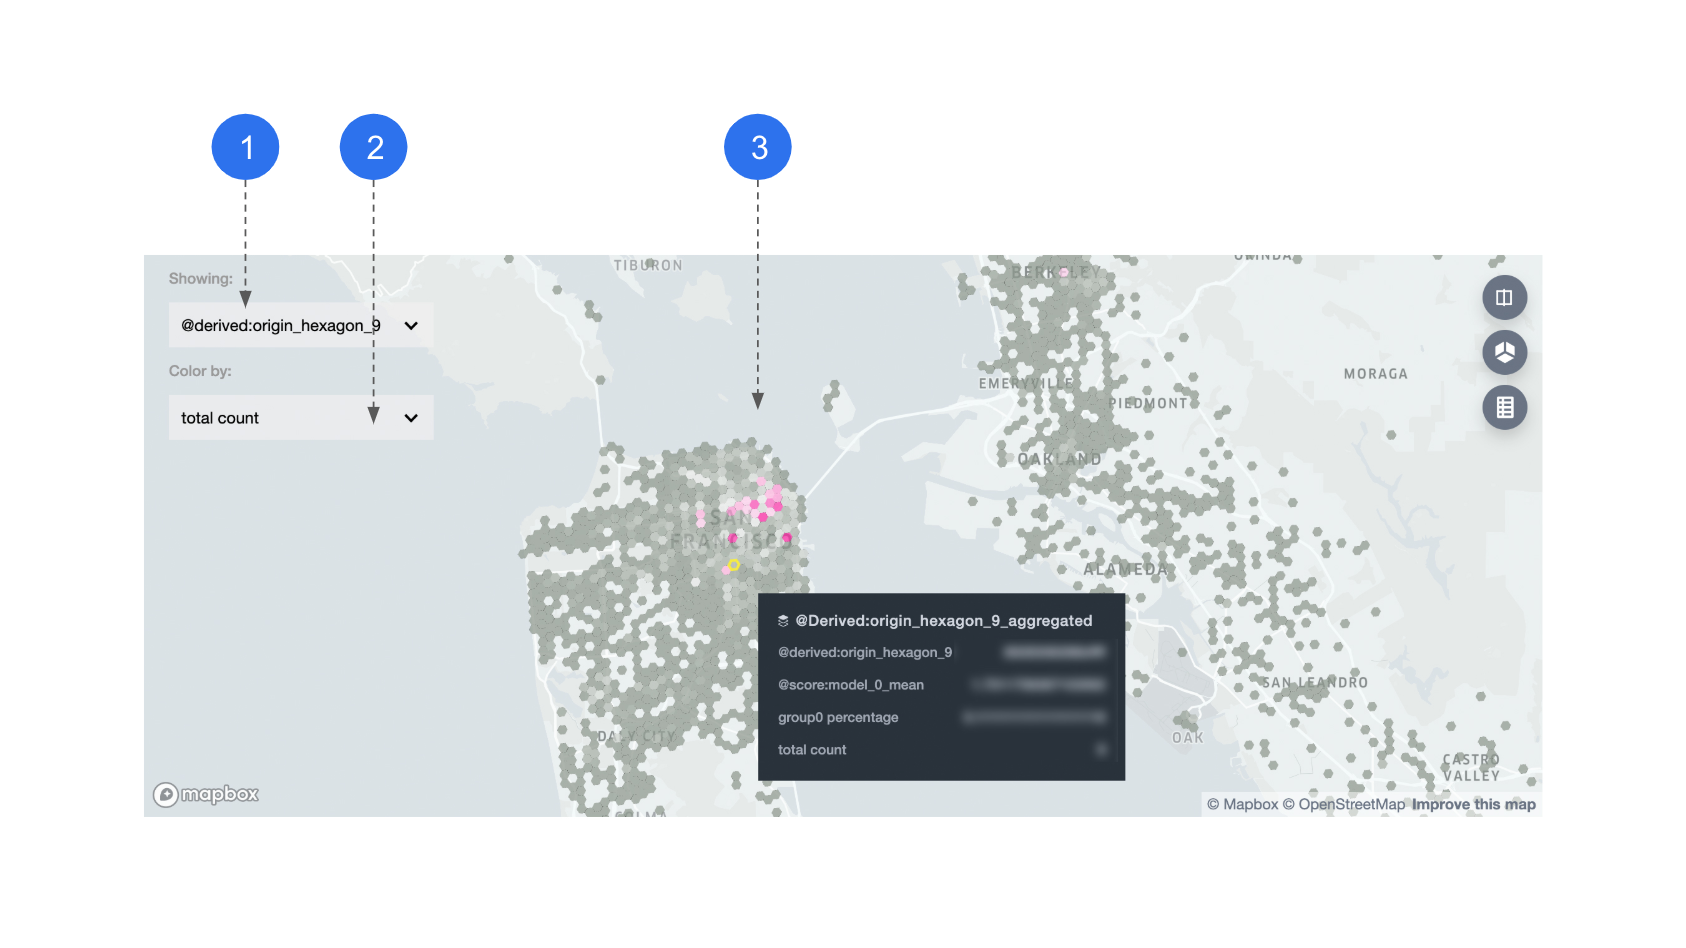
Hexagon binned heatmaps, used for displaying spatially aggregated 1-Dimensional data (e.g. values of one feature):
The drawbacks are:
- Overlapping heapmaps might occlude information
- It's hard to show multiple dimensions at the same time
We need to invent new visual encodings to fix it.
Inspirations: https://pair-code.github.io/interpretability/uncertainty-over-space/