Density of coalescences / effective population size estimates
WIP related to #1315. Edited 14 Feb 22 into something resembling a usable API. @petrelharp @gregorgorjanc
This mock-up consists of a class in test_stats.py that: (a) walks over nodes in marginal trees; (b) assigns nodes to "blocks" of adjacent trees that can be easily resampled; (c) calculates weights for node times according to a user-provided function -- for example, calculating the number of pairs/trios of a particular population labelling that coalesce in a particular node -- then sums these across trees for each unique node/block combination; (d) provides member functions for the ecdf of the resulting distribution of event times, and a simple estimator of average event rate in time intervals; (e) provides a generator for bootstrapping that reweights nodes by resampling blocks of trees. Conceptually, this is a concise representation of a distribution of event times; the distribution of what exactly depends on the choice of how nodes are weighted. Special cases include pairwise coalescence times, pairwise cross-coalescence times, and first coalescence times of trios/quartets. Applications for these include the fitting of single- or multi-population demographic models with time-varying Ne/migration, but they are likely interesting in their own right as summary statistics (e.g. in sliding windows across the genome).
This could easily be refactored as a standalone function (still allowing arbitrary weighting) or several functions (with defined weights, e.g. for pairwise coalescence). The reason it's written as a class is to allow quick recomputation of coalescence rates for different discritizations of time, or fast querying of specific event times w/ the accompanying weight. This allows some interactivity in selecting the resolution of the time discritization, without having to pass over the marginal trees each time. The idea is that the reduction to a single record per unique node id keeps the storage requirements low. But this design might not translate very easily to local estimates on genomic windows.
usage example
sample_sets = [population1, population2, population3] # distinct sets of samples
time_distr = CoalescenceTimeDistribution(ts, sample_sets,
                weight_func = count_leaf_pairs, num_blocks = 100)

time_grid = numpy.linspace(0., max_time, num_time_points)

# returns array with shape ( length_of_weighting_function_output , num_time_points )
time_distr.ecdf(time_grid)
time_distr.num_coalesced(time_grid)
time_distr.num_uncoalesced(time_grid)

# returns array with shape ( length_of_weighting_function_output , num_time_points - 1)
# e.g. "time_grid" is used as breaks for windows wherein time-average rates are calculated
time_distr.interval_coalescence_rate(time_grid)
# for this choice of weight_func, the inverse of the coalescence rate is an estimate of haploid Ne
1./time_distr.interval_coalescence_rate(time_grid)

# generates copies with node weights adjusted according to a block resampling scheme
time_distr_boot = time_distr.block_bootstrap(num_replicates, random_seed)
next(time_distr_boot).interval_coalescence_rate(time_grid) # resampled summary statistics
where
def count_leaf_pairs(nd, tr, sample_sets):
    ss = sample_sets
    wts = np.array([0]*len(ss), dtype="int32")
    if tr.is_internal(nd):
       # number of descendants per child across sample sets
       ch = tr.children(nd)
       nd = [[len([j for j in tr.leaves(c) if j in s]) for s in ss] for c in ch]
       # weights are the number of pairs with a TMRCA at node
       for s in range(len(ss)):
           for i in range(len(ch)-1):
               for j in range(i+1, len(ch)):
                   wts[s] += nd[i][s] * nd[j][s]
    return wts
is one possible weighting function, that returns the number of pairs of samples that coalesce at the node across different sets of samples (e.g. populations). More complex choices could include counting of topologies matching a particular population labeling and position of focal node, for example counting embedded topologies of the form ((A,B):node,C) where A,B,C are population labels and node is the node ID.
Ne estimation and confidence intervals
This only really applies to pairwise coalescence rates, but could serve as the starting point for a tutorial. Assume a single population with piecewise-constant effective population size through time. The ith epoch has duration d_i and effective population size n_i. The probability that a pair of lineages will coalesce by the end of epoch i is p_i = 1 - exp(-d_i / n_i) (conditional on the pair having not already coalesced by the beginning of the epoch). Let there be k_i independent pairs of lineages that haven't coalesced by the start of epoch i -- for example, genealogies for independently segregating tracts of DNA that have been split by non-overlapping pairs of samples. Let the number of pairs that coalesce during epoch i be x_i. Because sample pairs/genealogies are independent, x_i follows a binomial distribution with size k_i and probability p_i. Then, the MLE for n_i is -d_i/log(1 - x_i/k_i). Its standard error can be calculated from by twice-differentiating the binomial pmf with regard to n_i, evaluating at the MLE, etc. Confidence intervals could then be calculated using the normal approximation, or by inverting the endpoints of a more accurate binomial confidence interval (because there's a 1-to-1 relationship between n_i and p_i).
Validation
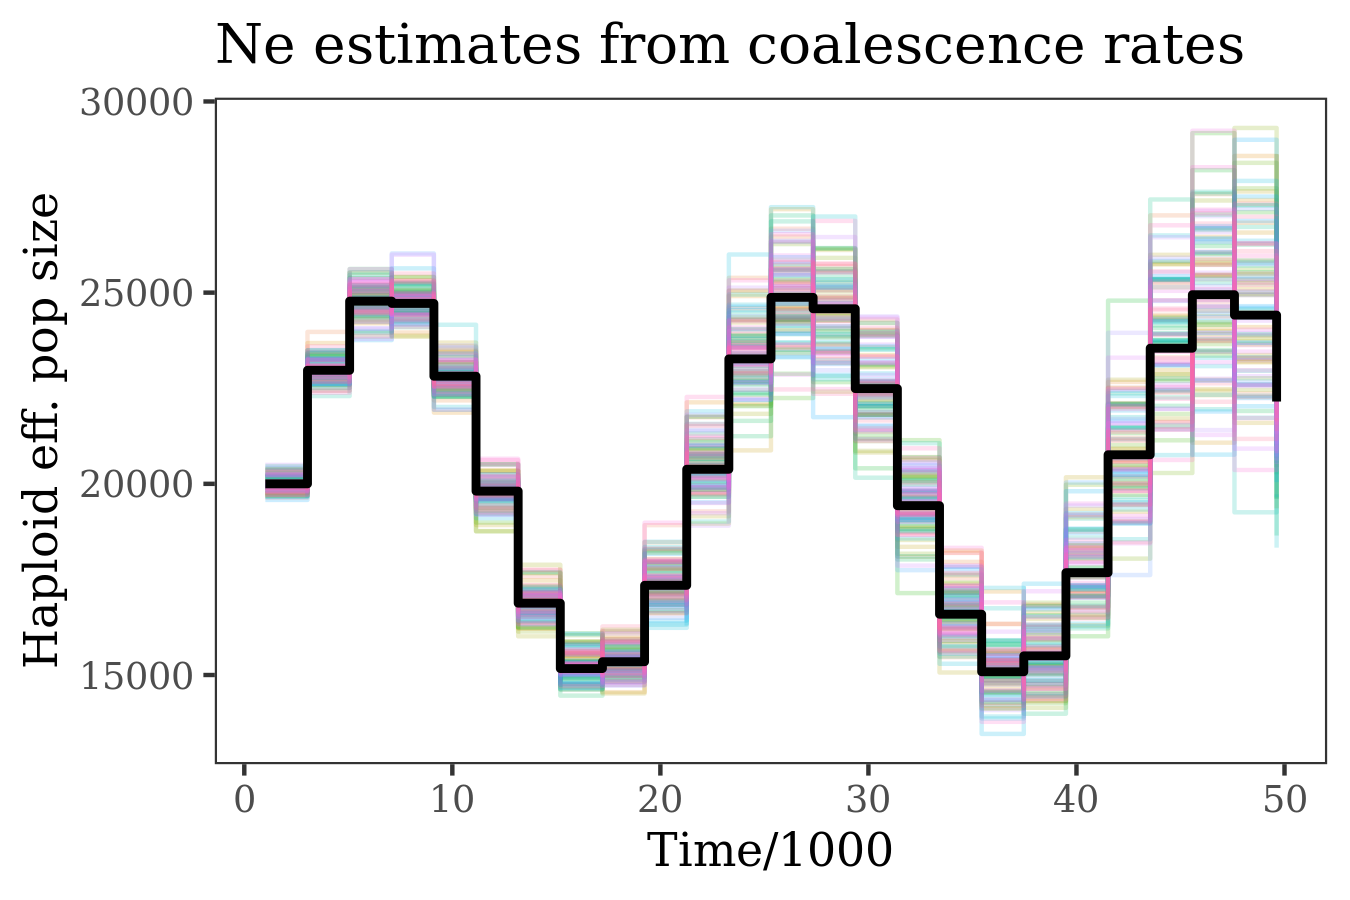
Here are single-population Ne trajectories estimated using the method described above, for 100 simulations from a "sin wave" demography. These are calculated using x_i, k_i summed over 10 pairs of samples. Each simulation uses 10000 independent genealogies (so k_0 is 100000 for each simulation). The black line is the truth, colors are estimates across simulations.
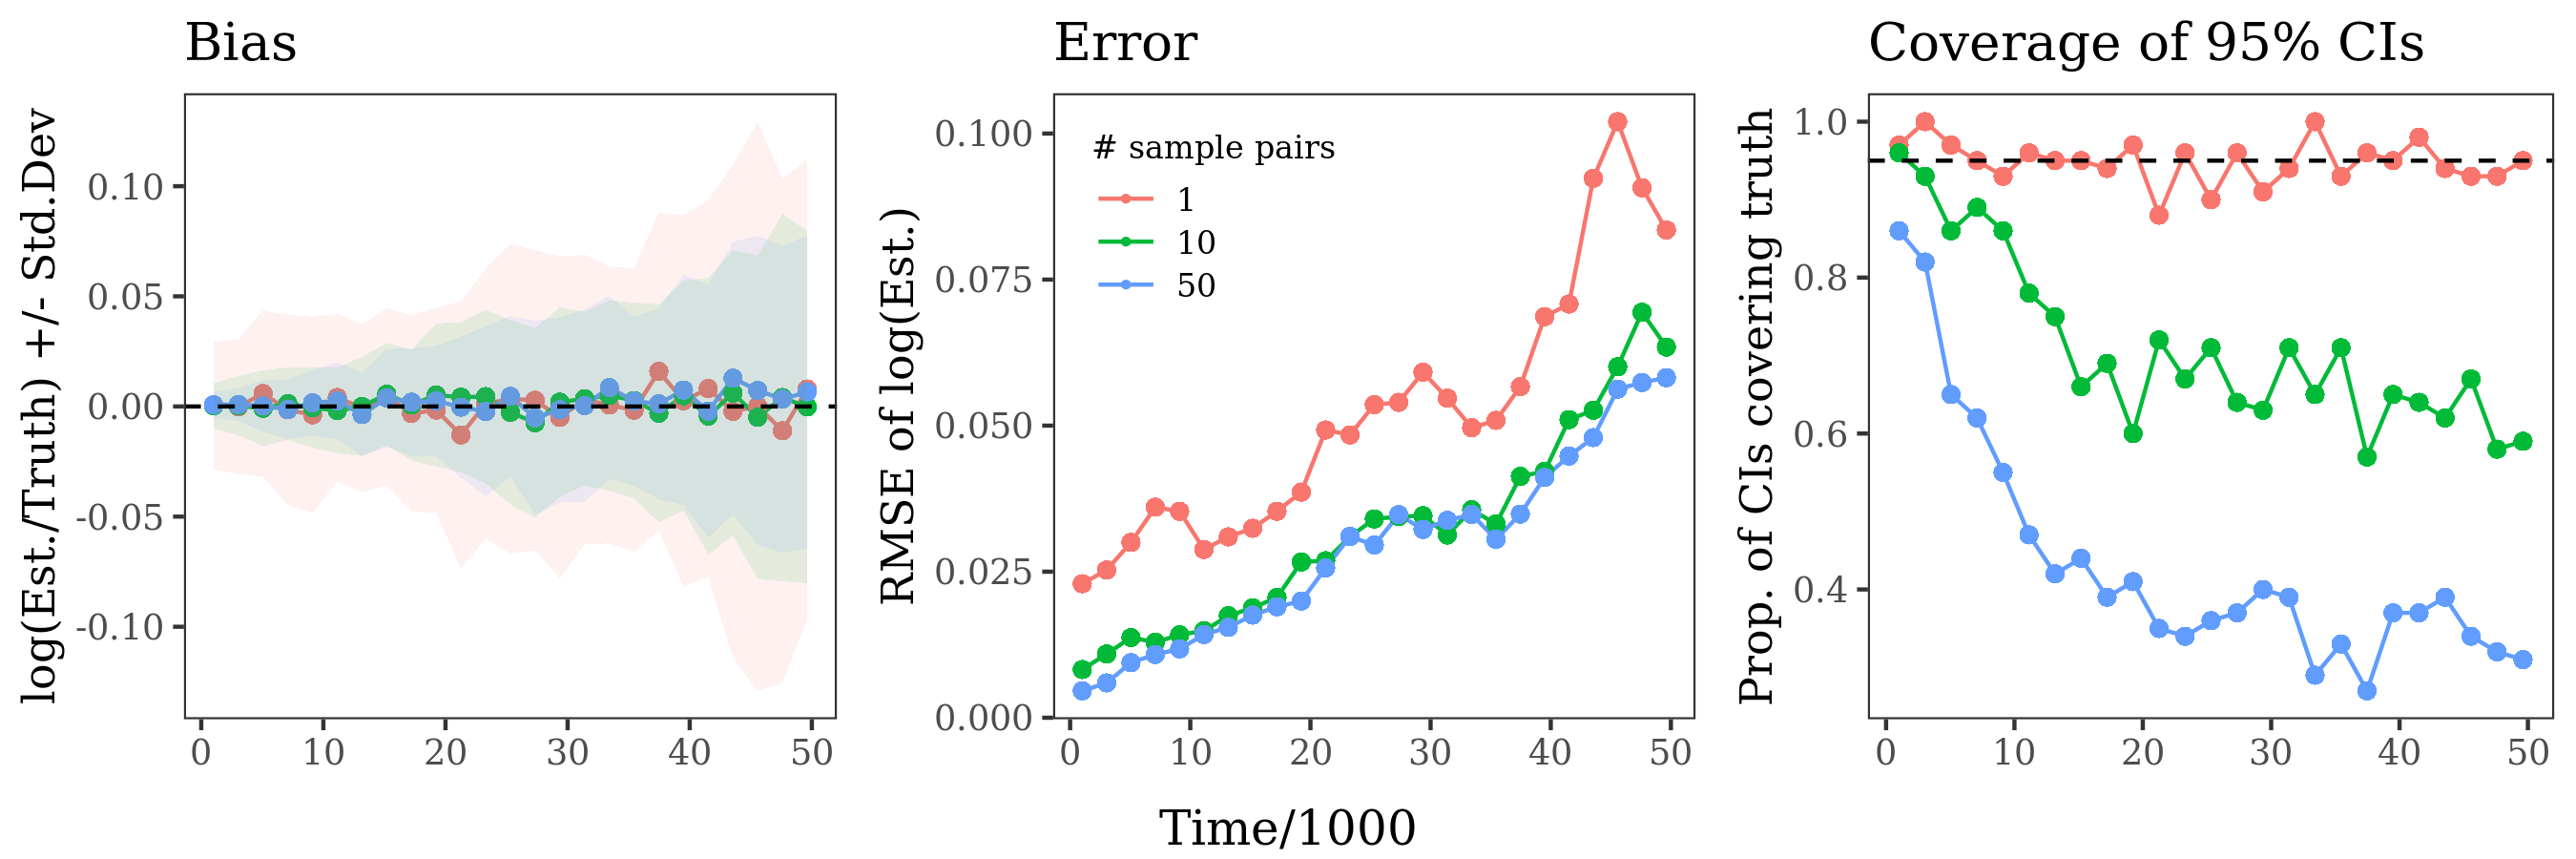
Here is bias / RMSE / confidence interval coverage from the same set of simulations, summing x_i, k_i across
different numbers of sample pairs. The estimates are unbiased regardless of the number of sample pairs used, but are more accurate with more sample pairs. For estimates calculated with a single sample pair, confidence intervals have the desired 95% coverage. However coverage declines rapidly when more sample pairs are used, especially for older windows. I think this is because older coalescence events get counted multiple times like described my comment below, so the binomial model no longer applies. Block bootstrapping produces CIs with much better coverage (not shown).
Codecov Report
Merging #2119 (af37b7f) into main (5a3ebde) will increase coverage by
5.04%. The diff coverage is98.37%.
:exclamation: Current head af37b7f differs from pull request most recent head bcedf5d. Consider uploading reports for the commit bcedf5d to get more accurate results

@@            Coverage Diff             @@
##             main    #2119      +/-   ##
==========================================
+ Coverage   93.91%   98.95%   +5.04%
==========================================
  Files          27       16      -11
  Lines       27200     6781   -20419
  Branches     1215     1266      +51
==========================================
- Hits        25544     6710   -18834
+ Misses       1622       33    -1589
- Partials       34       38       +4
| Flag | Coverage Δ | |
|---|---|---|
| c-tests | ? |
|
| lwt-tests | ? |
|
| python-c-tests | ? |
|
| python-tests | 98.93% <98.37%> (-0.03%) |
:arrow_down: |
Flags with carried forward coverage won't be shown. Click here to find out more.
| Impacted Files | Coverage Δ | |
|---|---|---|
| python/tskit/stats.py | 98.57% <98.35%> (-1.43%) |
:arrow_down: |
| python/tskit/trees.py | 98.75% <100.00%> (+<0.01%) |
:arrow_up: |
| c/tskit/convert.c | ||
| python/_tskitmodule.c | ||
| c/tskit/stats.c | ||
| c/tskit/trees.c | ||
| c/tskit/haplotype_matching.c | ||
| python/lwt_interface/tskit_lwt_interface.h | ||
| c/tskit/genotypes.c | ||
| c/tskit/core.c | ||
| ... and 3 more |
Continue to review full report at Codecov.
Legend - Click here to learn more
Δ = absolute <relative> (impact),ø = not affected,? = missing dataPowered by Codecov. Last update 5a3ebde...bcedf5d. Read the comment docs.
This looks great @nspope !!!
@janaobsteter you can try it on your bee tree sequence work
There is something that I am not grasping about the dependence between the TMRCAs for non-overlapping pairs of samples in the same genealogy, and how this relates to the binomial model described in the OP.
The TMRCAs for a single sample pair follow an exponential distribution, and counts of coalescence events in a time window (across independent genealogies) follow a binomial distribution. However, for the sum of counts over multiple non-overlapping sample pairs, the distribution of counts is not binomial in general, because both pairs might have the same MRCA. For example, in the genealogy
5.01┊    6    ┊
    ┊  ┏━┻━┓  ┊
1.43┊  ┃   5  ┊
    ┊  ┃  ┏┻┓ ┊
0.66┊  4  ┃ ┃ ┊
    ┊ ┏┻┓ ┃ ┃ ┊
0.00┊ 0 3 1 2 ┊
    0         1
sample pairs (0, 1) and (3, 2) both have the same MRCA (6). This coalescent event is double-counted when tallying TMRCAs in time windows over both pairs. So, in this case the binomial model doesn't hold. The estimator -d_i / log(1 - x_i/k_i) still seems to be unbiased, but the std error is lower than it should be.
Ideally, we'd be able to sample subtrees from genealogies in a way that gives independent counts. Something like this:
- Iterate over internal nodes
- For each internal node choose a pair of descendant leaves, where neither member of the pair has been previously selected (for a previously visited node). If this is not possible, discard this node and move on.
- Tally the times associated with the retained internal nodes across windows, and use these in the binomial model
I have to work through this procedure more carefully, but I think it would result in sums of independent counts per time window. (EDIT: This doesn't work ... and in general I can't figure out a way avoid re-counting internal nodes, without skewing the distribution of TMRCAs for pairs of leaves)
Awesome, thanks @nspope. This is a great start, and there's quite a bit to think about here. Here's some thoughts so far (and some are probably silly due to not thinking enough!):
About the interface: we have a proposed way to specify time windows in #665, that talks through e.g. what to do if both windows and time_windows are passed in. What do you think?
About confidence intervals: Perhaps the issue of getting a good estimator and obtaining uncertainty estimates can be disentangled somewhat. You have great suggestions for how to get uncertainty for a single tree, but extending these ideas to a region of the genome with many trees seems difficult? But: maybe I'm missing something? Perhaps a more general-purpose way to get uncertainty would be a block bootstrap of some kind? (e.g., compute estimates in windows of the genome that are the original windows subdivided in 5, and use the variance across these?)
More generally, I'm wondering what is the interpretation of this estimator as an empirical description of the genealogies? For instance, is it related to the ECDF of the pairwise coalescence times? If so, why do we need the restriction to non-overlapping pairs of lineages? Having a nice empirical interpretation like this is nice for communication, and understanding what the statistic is telling us about the trees, independent of a particular model (ie a randomly mating pop of size Ne).
An alternative method might be to instead of taking pairwise TMRCAs of samples, to take the number of distinct lineages; so in your example:
5.01┊    6    ┊
    ┊  ┏━┻━┓  ┊
1.43┊  ┃   5  ┊
    ┊  ┃  ┏┻┓ ┊
0.66┊  4  ┃ ┃ ┊
    ┊ ┏┻┓ ┃ ┃ ┊
0.00┊ 0 3 1 2 ┊
    0         1
after 0 and 3 coalesce into 4 you've only got one lineage remaining, not two. Of course, doing things this way makes interpretation harder, especially if we're thinking about cross-coalescence rates.
This does look great @nspope and it's a really important piece of functionality. I wonder if it'd be worth talking through at one of our community meetings? These happen every other Wednesday 11:30EST, next one is on 16th. Would you be willing to talk us through what you've done here, and maybe we could discuss how to take it forward?
@jeromekelleher Sure, I can join you all on the 16th. If you need to reach me outside of Github with details on how to join, I'm at nspope at utexas dot edu.
@petrelharp Great, thanks for the feedback, I agree that summary statistics vs demographic inference should be distinct in the implementation. A block bootstrap is really easy to implement here, as it just requires "re-weighting" counts across genomic windows with multinomial weights. The restriction to non-overlapping sample pairs is totally unnecessary -- this was just my (misguided) attempt at getting counts of coalescences that better match the binomial model described in OP (to try to strike a balance between accurately quantifying uncertainty and using all available information). I'll respond in detail when I have a moment.
Hey @petrelharp,
More generally, I'm wondering what is the interpretation of this estimator as an empirical description of the genealogies? For instance, is it related to the ECDF of the pairwise coalescence times? If so, why do we need the restriction to non- overlapping pairs of lineages? Having a nice empirical interpretation like this is nice for communication, and understanding what the statistic is telling us about the trees, independent of a particular model (ie a randomly mating pop of size Ne).
Here's my thinking ... Let n(t) be the haploid effective population size; then c(t) = 1/n(t) is the pairwise coalescence rate (or "hazard" in survival modelling jargon). The cumulative rate is C(t) = \int_0^t c(x) dx, and the cumulative distribution function of pair coalesence times is F(t) = 1 - exp(-C(t)). If F'(t) is the derivative with respect to time, then we have n(t) = (1 - F(t)) / F'(t).
Lets say we have an empirical CDF G(t), taken from the pairwise TMRCAs of a tree or tree sequence. Of course this is piecewise constant and not smooth, but its expectation (wrt possible genealogies) is F(t). What we're after is an estimate of the effective population size and pair coalescence rate through time. One way to go about estimating these would be approximate F(t) by fitting some smooth monotonic function F_hat(t) to G(t), then plug F_hat and its time derivative into the relationship between n(t) and F(t) above. This is an interesting option, but is a bit of a can of worms ... because we'd have to make decisions about how smooth to make F_hat(t) and that will have a potentially huge influence on F_hat'(t) and thus the associated estimates of n(t) and c(t) (especially when we get far enough back in time that there are few uncoalesced lineages, or when applied to a relatively small genomic interval). There's also the issue that in any (real) dataset, there is inevitably going to be error in the inferred TMRCAs. So for now, maybe we can punt the "fit a smoother" idea down the road.
A simpler alternative (that's more robust to error in the inferred TMRCAs) is to chunk up time into intervals and use G(t) to directly approximate F(t). Then, we can reframe the problem as trying to get an average coalescence rate for each interval. When time is discretized like this, we really only care about whether a particular interval contains a given TMRCA, so it's analogous to an interval-censored survival model.
Consider a time interval [a, b). The cumulative coalesence rate in this interval is C(b) - C(a) = c_bar * (b - a) where c_bar = (\int_a^b c(x) dx) / (b - a) is the average rate of the interval. To relate this back to the estimator that I wrote about in the OP, let k be the number of uncoalesced lineages at time a, and let x be the number of lineages that coalescence in [a, b). These relate to the ECDF via,
x / k = (G(b) - G(a)) / (1 - G(a)) \approx (F(b) - F(a)) / (1 - F(a)) = 1 - exp(-(b - a) * c_bar)
and solving this gives c_bar \approx -log(1 - x/k) / (b - a) (the estimator). Finally, 1 / c_bar = (b - a) / (\int_a^b 1/n(x) dx) is the harmonic average of effective population size over the interval, which I think is what interests @gregorgorjanc.
With regards to block bootstrapping -- I totally agree, this would be a great way to get getting confidence intervals for a global set of estimates calculated for the entire tree sequence. But, I think it would be challenging to use block bootstrap to get CIs for local estimates calculated on small genomic intervals that may just contain a few trees. In this case, something like the binomial model I laid out in the OP might work -- if the standard error could somehow be adjusted to account for the dependence between pair TMRCAs in a genealogy, or pairs could be subsampled to better approximate an independent sample (this idea prompted my misguided effort to restrict estimates to non-overlapping pairs). Unlike everything written above, the non-independence of TMRCAs seems specific to the coalescent and not to survival modelling or non-homogeneous point processes in general.
Sorry for the text dump!
@nspope thanks for this great "text dump"!
Just a note that tsdate can estimate node ages, hence TMRCA, but there will inevitably be errors, so time-binning should work fine, at least for what we need.
Great, @nspope - this is perfect! Well-explained, and I think also a very good approach. Here's some notes:
- The numbers
xandkare the "raw" input here, and these are of independent interest (as a more fundamental descriptor of the lineages, and the ingredients for more sophisticated estimators), so I'd vote for writing the low-level methods that just compute and return the arrays of these, then the Ne(t) estimator as a layer on top of that. (And, maybe we just needx?) - I think there's at least two options for what
x(andk) is: one is "how many of the pairs of samples are not yet coalesced", and the other is (n choose 2), where n is "how many distinct lineages ancestral to the samples are there". This amounts to a different weighting of the lineages present at the start of the time bin, and I think the second option should get a smaller variance because the things we're putting into G(t) are more independent. (Since if i and j have already coalesced, then T(i,k) = T(j,k) by necessity.) I think both could be useful, as the first one is closer to the data. - This obviously extends to pairwise coalescence rates!
- I'm inclined to return coalescence rates instead of "effective population sizes"? If people want the latter, they can just invert them?
- Genomic windows can be pretty small and still contain a lot of trees, so the block bootstrap might still be useful. However, not always, you're right - and, how much independence we get depends on how long ago we're talking about (more recent times would need bigger windows). I agree, though, the binomial confidence intervals seem promising - there ought to be some approximation we can make?
Thanks @petrelharp,
The numbers x and k are the "raw" input here, and these are of independent interest (as a more fundamental descriptor of the lineages, and the ingredients for more sophisticated estimators), so I'd vote for writing the low-level methods that just compute and return the arrays of these, then the Ne(t) estimator as a layer on top of that. (And, maybe we just need x?)
Here's an idea ... we organize these methods into a class. The member functions of this class are something like ecdf(self, time), num_uncoalesced(self, time), num_coalesced(self, time), that return the values of G(t), k(t), x(t) along a supplied time grid. The member data of this class would be a table, where each row corresponds to a node in the tree sequence. Rows would be sorted by the time associated with each node. Columns of this table would include: the node times, the node positions, and the node weights. By node weights, I mean the number of sample pairs that coalesce in a given node, which (in a binary tree) is just the number of leaves descended from the left branch multiplied by the number of leaves descended from the right branch. Building this table would require just a single pass over the nodes of the tree sequence, when the class is instantiated.
The rationale behind this is that once the TMRCAs (node times) are time-sorted and pair-weighted, it is very efficient to calculate any of the quantities above at an arbitrary time point. By contrast, it seems likely the user would want to play with "binning" of coalescence events into time bins to calculate the pair coalescence rates, by changing the number/size of the time windows so as to have some control on the tradeoff between variance and temporal resolution. In this case, we'd want to avoid iterating over nodes each time a new set of estimators is calculated. So, there would be another member function along the lines of pair_coalescence_rates(self, time_windows, num_bootstrap=0, block_distance=None) that uses the sorted table to calculate the estimators and resamples nodes via a block scheme if num_bootstrap > 0. Of course there could be a local form of this that returns estimates across genomic windows.
But maybe I'm over-complicating things/reinventing the wheel? Or maybe there's a desire to limit the proliferation of classes in tskit?
I think there's at least two options for what x (and k) is: one is "how many of the pairs of samples are not yet coalesced", and the other is (n choose 2), where n is "how many distinct lineages ancestral to the samples are there". This amounts to a different weighting of the lineages present at the start of the time bin, and I think the second option should get a smaller variance because the things we're putting into G(t) are more independent. (Since if i and j have already coalesced, then T(i,k) = T(j,k) by necessity.) I think both could be useful, as the first one is closer to the data.
Sure, I agree both are useful. However (unless I'm misunderstanding), their respective ECDFs don't have the same expectation? So only the "pairwise coalescence rate" has the nice duality with effective population size that makes interpretation easy.
I'm inclined to return coalescence rates instead of "effective population sizes"? If people want the latter, they can just invert them?
I agree with coalescence rates as a default, but maybe provide a flag that controls which is returned. The reason is because if returning std errors or quantities calculated from bootstraps, the conversion of these wouldn't necessarily be as simple as just inverting them.
how much independence we get depends on how long ago we're talking about (more recent times would need bigger windows). I agree, though, the binomial confidence intervals seem promising - there ought to be some approximation we can make?
Thinking about this further ... clustered outcomes are definitely a phenomenon that is modeled in survival analysis. For example, all the machines in the tootsie roll factory break down at the same time because someone added too much sugar to the caramel (or something). So there may well already be a simple correction/approximation that could be relevant here.
Hi All,
So I've been working on implementing a few coalescence rate estimators for my own work and ran across this nice count-based estimator by @nspope.
I have many samples though, and it looks like running this current implementation over n samples is O(n²). I think a faster alternative is to run through the marginal trees and just count the number of leave pairs subtended by each node. One needs to be careful though, as an m-way multiple merger creates m choose 2 lineages, and each lineage pair i, j from this focal node has n(i)n(j) pairwise samples where n(i) is the number of leaves of the descendant lineage of i. I bashed out a quick draft implementation:
def count_tree_coalescence_pairs(tree, epochs):
    nepochs = len(epochs)
    times = dict()
    for tr in tree.trees():
        for node in tr.nodes():
            if tr.is_leaf(node):
                continue
            nlineages = np.array([tr.num_samples(child) for child in tr.children(node)])
            # get the number of subtended samples
            ns = functools.reduce(sum, (x*y for x, y in itertools.combinations(nlineages, 2)))
            t = tr.time(node)
            times[t] = ns + times.get(t, 0)
    counts = np.fromiter(times.values(), dtype=int)
    times = np.fromiter(times.keys(), dtype=float)
    indices = np.digitize(times, epochs)
    coalesced = np.zeros(shape=nepochs)
    np.add.at(coalesced, indices, counts)
    total = np.cumsum(coalesced[::-1])[::-1]
    return coalesced[1:], total[1:], epochs
Then, for some sample data:
tree = msprime.sim_ancestry(100, ploidy=2, recombination_rate=1e-8, sequence_length=1e6, population_size=1000, random_seed=5)
bins = np.linspace(0, 10000, 10)
Let's look at @nspope's total counts:
>>> t = np.stack([x['total'].tolist() for x in pairwise_coalescence_counts(tree, bins)['counts'].values()]).sum(axis=0)
>>> c = np.stack([x['coalesced'].tolist() for x in pairwise_coalescence_counts(tree, bins)['counts'].values()]).sum(axis=0)
>>> t, c
(array([3621800, 2202888,  731645,  409806,  117864,   60576,   56052,
          18684,       0]),
 array([1418912, 1471243,  321839,  291942,   57288,    4524,   37368,
          18684,       0]))
and my implementation (pardon the minor output differences, we can address this later):
>>> count_tree_coalescence_pairs(tree, bins)
(array([1418912., 1471243.,  321839.,  291942.,   57288.,    4524.,
          37368.,   18684.,       0.,       0.]),
 array([3621800., 2202888.,  731645.,  409806.,  117864.,   60576.,
          56052.,   18684.,       0.,       0.]),
 array([    0.        ,  1111.11111111,  2222.22222222,  3333.33333333,
         4444.44444444,  5555.55555556,  6666.66666667,  7777.77777778,
         8888.88888889, 10000.        ]))
Now, looking at the timing of @nspope's
>>> %timeit counts = pairwise_coalescence_counts(tree, bins)
6.16 s ± 317 ms per loop (mean ± std. dev. of 7 runs, 1 loop each)
and mine:
>>> %timeit count_tree_coalescence_pairs(tree, bins)
154 ms ± 7.27 ms per loop (mean ± std. dev. of 7 runs, 10 loops each)
So I think this speeds things up a bit (~250x faster) and may be of interest. I will work to refine and document the code if this is of interest — pardon my quick implementation here. Thanks to @andrewkern and @petrelharp for feedback on this approach!
Note: I refactored and edited the code example a few times and it went from ~82x (original post) to 400x faster (current version).
Thanks for the suggestion @vsbuffalo! Yup, I think we'll ultimately want to do a single pass over nodes. The tip-by-tip approach that I have currently implemented is really just a foolproof point of comparison/prototype, not in any way for speed or scalability. At this point, we're just hashing out exactly what we want to estimate, then I'll work on an efficient implementation.
I don't want to derail the conversation here, so no need to respond, but I just wanted to put the question into people's heads: should this type of functionality be in tskit, or is it something that's complex and independent enough to be in it's own repo/library? Something to chat about at the meeting on Wednesday anyway.
This is something I was wondering as well — I think there is a strong case that coalescent rate estimators should not be put in tskit, but perhaps a few of the functions that go into computing these rates are generalizable enough that they should make it in.
Unlike with diversity, or Fst, there doesn't appear to be a sort of canonical best estimator of coalescent rates. If we knew tree generating processing itself, there are likely better, tailored rate estimators we can construct. One recent paper that sticks out in my head is Edge and Coop (2019), which developed three estimators to infer allele frequencies and trait PGSs from trees. I think there's a case that tskit would just have to contain all kinds of useful estimators if it contains one, since they all are useful or terrible under different circumstances. From my experiments, @nspope's estimator seems like it performs rather well compared to the waiting-time estimator of Strimmer and Pybus (2001), but the latter is commonly used.
I do think, however, there are some general utility functions we could include that would be useful for all kinds of estimators. For example, functions to bin pairwise coalescence events and totals as used here, count the number of lineages at a particular time slice, a general proper block bootstrap for an arbitrary estimation function, etc. seem both general and tricky to implement efficiently that they may be contenders for inclusion. Either way, I think there is a strong case that we should write up a vignette on how to estimate coalescent rates as I imagine this could be useful to many.
@jeromekelleher @vsbuffalo In my opinion, it'd be useful to include a way to calculate counts of pair coalescence times in tskit, both across time/genomic windows and between defined groups (e.g. cross-coalescence between populations, with outgroup constraints, and so). My feeling is that variants of this kind of summary statistic will show up in more and more inferential methods in the future: they're both informative and analytically tractable under a wide range of models. So, I think it is worth hashing out an efficient and extendable way to calculate/summarise/resample these.
The downstream use of these statistics for demographic inference (or inference about selection, etc.) definitely seems beyond the scope of tskit. However, the duality between pair coalescence rate and Ne in an unstructured population is so simple (and so interpret-able) that in my opinion it would be useful to include a simple estimator of time-averaged coalescence rate, as a summary statistic in its own right. And to write a brief tutorial on how this relates to Ne under specific conditions.
One idea is to organize the process of counting/resampling into a class that could serve as a base for spin-offs like cross-coalescences. So for example, class PairCoalescenceTimes that only passes over nodes in marginal trees once, on instantiation. This would build a table that includes: node id, node time, node interval (boundaries of the leftmost/rightmost trees containing the node); node weights (number of descendant pairs that coalescence at the node, summed over marginal trees). Then, sort the table by time and calculate cumulative weights. Querying the ECDF at an arbitrary time point is a binary search over the table, and the ECDF can be used to calculate counts of uncoalesced/coalesced lineages or average coalescence rate in windows. Block bootstrapping would involve assigning nodes to blocks, drawing block weights from a multinomial distribution, and reweighting nodes accordingly. So a use case might look like,
focal_sets = [population1, population2, population3] # distinct sets of samples
coal_times = PairCoalescenceTimes(ts, focal_sets)

time_grid = numpy.linspace(0., max_time, num_time_points)

# returns array with shape ( len(focal_sets) , len(time_grid) )
coal_times.ecdf(time_grid)
coal_times.num_coalesced(time_grid)
coal_times.num_uncoalesced(time_grid)

# returns array with shape ( len(focal_sets) , len(time_grid)-1 )
# e.g. "time_grid" is used as breaks for windows wherein time-average rates are calculated
coal_times.binned_coalescence_events(time_grid) # raw counts
coal_times.binned_coalescence_rate(time_grid) # simple estimator

# generate a copy with nodes reweighted according to a block resampling scheme
coal_times_boot = coal_times.block_bootstrap(num_blocks, random_seed)
coal_times_boot.binned_coalescence_events(time_grid) # resampled raw counts
coal_times_boot.binned_coalescence_rate(time_grid) # resampled estimator
I have a prototype of this idea that I'll push shortly, and if there's time perhaps we could discuss on Wed.
This sounds great @nspope - looking forward to hearing more about this one Wednesday, and have a good discussion about how we get the infrastructure into tskit. I am sympathetic to @vsbuffalo's perspective here, but I totally see what you're saying too @nspope.
Yea that looks like a very clean API @nspope! I do think if there were to be a coalescent rate implementation, the pairwise approach is the best (rather than say the Strimmer and Pybus estimator which bakes in the Kingman k choose 2 numerator). I think one thing we could keep in mind is whether these data could go into other estimators like Speidel et al's waiting time estimator (p. 15).
I had one more thought regarding the discussion in #1315 (which prompted this PR) and the question of what fits into tskit (if anything). The way I've been viewing things has been a little myopic, I think. A more general perspective is that we are passing over nodes in marginal trees, and weighting node times so as to capture interesting relationships between particular topological features and particular points in time.
For example, if the node weights are uniform, then ECDF(t) approximates the distribution function of coalescence times of genealogies of a given size. If the node weights are the number of sample pairs coalescing at the node, then ECDF(t) approximates the distribution function of pairwise coalescence times, that happens to have a nice connection to effective population size in an unstructured population. If node weights are the number of sample pairs from separate "groups" coalescing at the node, then ECDF(t) approximates the distribution function of cross-coalescence times. And so on -- the "features" counted by the weights could be any sort of topological pattern. The choice of what to count should be left to the user. For instance: I study adaptive introgression ... so I could use weights that count the possible topologies for 4 samples from different subspecies. Taken together these would give the ingredients for something like a time-aware ABBABABA statistic, that I could compare to simulations.
Whatever the choice of node weights, the distribution that is being approximated is a time-to-event (survival) process. So the question for implementation is, what summary statistics are useful ways of describing these processes? The ECDF, of course, but that's not a very concise description and will be sensitive to error in the inferred node times. Raw moments are maybe too concise. I think more useful statistics come from survival analysis, such as estimates of the average event rate (hazard function) in time windows.
I suppose what I'm suggesting is an interface to get summary statistics from any time-to-event distribution that arises from counting a particular topology in a tree sequence for each node. These statistics could include familiar estimators from survival analysis (like the interval estimator in the OP). Then, a block bootstrap scheme that generates bootstrap replicates wherein each node weight is multiplied by its corresponding block weight. For example, the API that I laid out above would look like this instead:
sample_sets = [population1, population2, population3] # distinct sets of samples
time_distr = CoalescenceTimeDistribution(ts, sample_sets, weighting_function = count_sample_pairs)

time_grid = numpy.linspace(0., max_time, num_time_points)

# returns array with shape ( length_of_weighting_function_output , num_time_points )
time_distr.ecdf(time_grid)
# etc. -- summary statistics at time points

# returns array with shape ( length_of_weighting_function_output , num_time_points - 1)
# e.g. "time_grid" is used as breaks for windows wherein time-average rates are calculated
time_distr.binned_hazard_rates(time_grid)
# etc. -- summary statistics in time intervals

# generates copies with node weights adjusted according to a block resampling scheme
time_distr_boot = time_distr.block_bootstrap(num_blocks, num_replicates, random_seed)
next(time_distr_boot).binned_hazard_rates(time_grid) # resampled summary statistics
where weighting_function would take a node id, a tree, and a partition of samples; and return a vector of weights for the node. For example, to count the number of coalescing pairs across each population:
def count_sample_pairs (node, tree, sample_sets):
    weights = [0]*len(sample_sets)
    if tree.is_internal(node):
        ch = tree.children(node)
        for j in range(len(sample_sets)):
            # count number of samples in sample set per child
            ss = sample_sets[j]
            nlineages = np.array([len([i for i in tree.leaves(j) if i in ss]) for j in ch])
            # get the number of subtended pairs
            weights[j] = functools.reduce(sum, (x*y for x, y in itertools.combinations(nlineages, 2)))
    return weights # counts of pairs from each sample set
Maybe this is too broad/tangential to discuss here. But (for me at least) would be a more useful functionality than the special case of estimating pair coalescence rate or Ne.
Nice idea, @nspope - but, since nodes extend over many trees and the number of samples below them can change, the appropriate entry in this table wouldn't be the node, but instead each node could have many rows, one new one each time the samples below it change. @awohns has called this (or something close to it) a "brick". If pre-computing this would make other things much quicker, then I'm for it; but, I'm not sure - I think computing summaries is pretty close to things we already do?
Here's some thoughts. Recall that right now we have the machinery all set up to keep track of, at each node, how many samples in various sample sets are below that node, and efficiently update this as we iterate over trees. To keep things simpler, let's consider cross-coalescence between sample sets A and B. For instance, the node statististic corresponding to divergence between A and B counts, for a node n, what proportion of paths between (a, b) pairs pass through the branch above n. Let's call this p(n). The fundamental thing we want to do here is to find out "what proportion of (a, b) pairs coalesce in this node"; if the children of node n are c1, ..., ck then this is p(c1) + ... + p(ck) - p(n), since a path (a,b) contributes to p(c1) if a is below c1 and b is not (or vice-versa); so if a path contributes to p(c1) but not p(n) then the MRCA must be n. (note: I think there's some double-counting that makes this not quite right, but it can be fixed.) So, this says that to compute what we'd like to, we can take the basic statistics machinery and modify it so that summaries can depend on the difference between the value at a node and its children (rather than just on the value at a node). Alternatively, we could write things summing across edges, where we get to know for each edge what is the value at the top and bottom of the edge, and the times of these.
Edit: I've just seen the suggestion to have a more general "weighting function" interface. I like it! I'm not yet sure it needs to be a separate class - that depends on the underlying computation, I think? - but, I strongly agree that if we work out what useful generalizations will be then we'll get the right API.
@petrelharp ok, I'll work out a prototype and we can see if it's too redundant with the existing stats machinery. I still think it's possible to avoid multiple rows per node (because the total weight for a given node is the sum of weights for that node across marginal trees), but it'll quickly become obvious if I'm wrong!
I suppose what I'm suggesting is an interface to get summary statistics from any time-to-event distribution that arises from counting a particular topology in a tree sequence for each node.
Ok, what exactly is this class of statistics? Here's one suggestion (brainstorming): given some samples a1, ..., am and some others b1, ..., bn, then find the distribution of times of nodes that are MRCAs of a1, ..., am but not ancestors of b1, ..., bn? (Note that by adding time windows to our existing statistics we'd be able to get the time distribution of ancestors of a1,... am but not b1, ... bn; what's different here is that it's only the MRCAs.) This could be extended to averaging over draws from m and n sample sets. What did you have in mind?
I could use weights that count the possible topologies for 4 samples from different subspecies. Taken together these would give the ingredients for something like a time-aware ABBA/BABA statistic, that I could compare to simulations.
There's an important distinction to get straight here - ABBA/BABA statistics count mutations, and therefore behave like statistics of branch lengths (since mutations fall on branches). If we just added time windows to our current stats, we'd automatically be able to partition ABBA/BABA out by time. What you're referring to here is like ABBA/BABA but looking at times of most recent common ancestors. (Instead of, I guess, times of all ancestors satisfying some criterion; compare also to the "node" version of f4. This seems like a good idea, but I haven't thought through what the differences would be?
I still think it's possible to avoid multiple rows per node (because the total weight for a given node is the sum of weights for that node across marginal trees)
Ah, since each node has a unique time; good point. I'm liking this! Restating - the resulting object would be, essentially, a collection of weighted times; if weights are nonnegative you could think of this as a distribution of times.
One possible issue with the "return all unique times and associated weights" approach (rather than just having a method of the tree sequence that returns the already-binned objects) is that if you want to do this in many windows along the genome (say, 10,000 windows) the size of the output gets rather large.
@petrelharp
Ok, what exactly is this class of statistics?
I'm thinking things like Kaplan-Meier product limit estimator, the interval hazard rate estimator in the OP (which has a name I'm forgetting) -- just estimators of the hazard function / survival function at particular points in time.
There's an important distinction to get straight here - ABBA/BABA statistics count mutations, and therefore behave like statistics of branch lengths (since mutations fall on branches).
Yes, I meant that as an loose analogy to a statistic that is sensitive to introgression, not as an equivalence. What I was getting at, is that the distributions of TMRCAs for the different possible topologies of the 4 samples would give not only information about whether introgression was taking place, but when it was taking place. Similarly to how cross-coalescence trajectories carry information about both the level of gene flow between populations and the timing of the gene flow. If there's time on Wed I'll give an example of this from my own work
Ah, since each node has a unique time; good point. I'm liking this! Restating - the resulting object would be, essentially, a collection of weighted times; if weights are nonnegative you could think of this as a distribution of times.
Yes, that's exactly it! In what I'm envisioning, weights are counts -- so it is a distribution of times (some of which are duplicated), and the weights are the multiplicities of each unique value.
One possible issue with the "return all unique times and associated weights" approach (rather than just having a method of the tree sequence that returns the already-binned objects) is that if you want to do this in many windows along the genome (say, 10,000 windows) the size of the output gets rather large.
Right, I haven't thought this through for the "local" version. However, I am suggesting we keep track of the left-most/right-most extent of each node. If genomic windows are large, this could be used to get local estimates without needing to repeat the table building for each genomic window. Of course, it would be sloppy near the breakpoints of windows. My intent was to use this positional information for bootstrapping (where a little bit of sloppy is OK).
edit: Alternatively, if the genomic intervals are specified when the class is instantiated, then these block assignments could be recorded while the table is built. For example, when a node "crosses" a breakpoint (is found in two blocks), it would get two rows in the table, one for each block, and could have different weights in these rows.
I think if we get one or two more good examples besides "coalescence rate" then we'll see how to generalize.
I am suggesting we keep track of the left-most/right-most extent of each node. If genomic windows are large, this could be used to get local estimates without needing to repeat the table building for each genomic window. Of course, it would be sloppy near the breakpoints of windows. My intent was to use this positional information for bootstrapping (where a little bit of sloppy is OK).
Good points in general - just a small note that this doesn't quite work since weights change along the span of a node. (Maybe this is what you mean by "sloppiness", though?)
I think if we get one or two more good examples besides "coalescence rate" then we'll see how to generalize.
I can provide an example of counting distinct topologies of sample trios (from different populations) to jointly estimate migration rates / Ne in time windows. Another thing that springs to mind is Figure 4C in Spiedel et al -- there they are counting trees where exceptionally long branches are descended from particular nodes.
Good points in general - just a small note that this doesn't quite work since weights change along the span of a node. (Maybe this is what you mean by "sloppiness", though?)
Yeah, that's what I meant by sloppy. Another option is to specify the genomic intervals when the class is instantiated. Then these "split-block" assignments could be recorded while the table is built. For example, when a node crosses a breakpoint (is found in two blocks), it would get two rows in the table, one for each block, that would have different weights.
You mention counting tree topologies @nspope, so pointing out the combinartorics stuff in case you're not aware of it.
I'll be curious to see the details - there's a lot of possible ways to go with the details.
@petrelharp OK I think this is to a point where we can tell if this idea will work or flop. A short example is in the (in progress) test class here, and the I updated the OP with a longer usage example.
- For bootstrapping, I ended up dividing trees into equal sized blocks (rather than by genomic coordinates). I think this is reasonable -- the number of recombination events per block should be similar. The number of blocks is specified at the outset, and then each stored record is a unique node+block combination. A different strategy will definitely be needed for a local version for genomic windows.
- With the recombination rate (1e-8) and block size (10 per Mb) I was playing around with, it seems like the number of records is roughly the number of trees. I don't think that's too bad? Definitely better than for every node in every marginal tree.
- This would be easy enough to refactor into a standalone function, if you think that'd be better design.
I'm curious what you think. Also (I know it's a bit late to ask this) but how far has this discussion deviated from your original feature idea in #1315? If you think this is getting way over-complicated, I'm fine with pulling back to something more concise.