deluge_exporter
 deluge_exporter copied to clipboard
[Feature request] Provide a complete Grafana dashboard
Thank you for this project. It's really useful to me!!!
I'm using this Dashboard to display the metrics but it only displays really basic information. Over the time I have added some relevant metrics for me but I would like to have a more complete dashboards.
Do you have an advanced dashboard with all the metrics? Could you share it?
Could you contribute your dashboard, because that grafana library one is out of date in all the libtorrent metrics, it seems
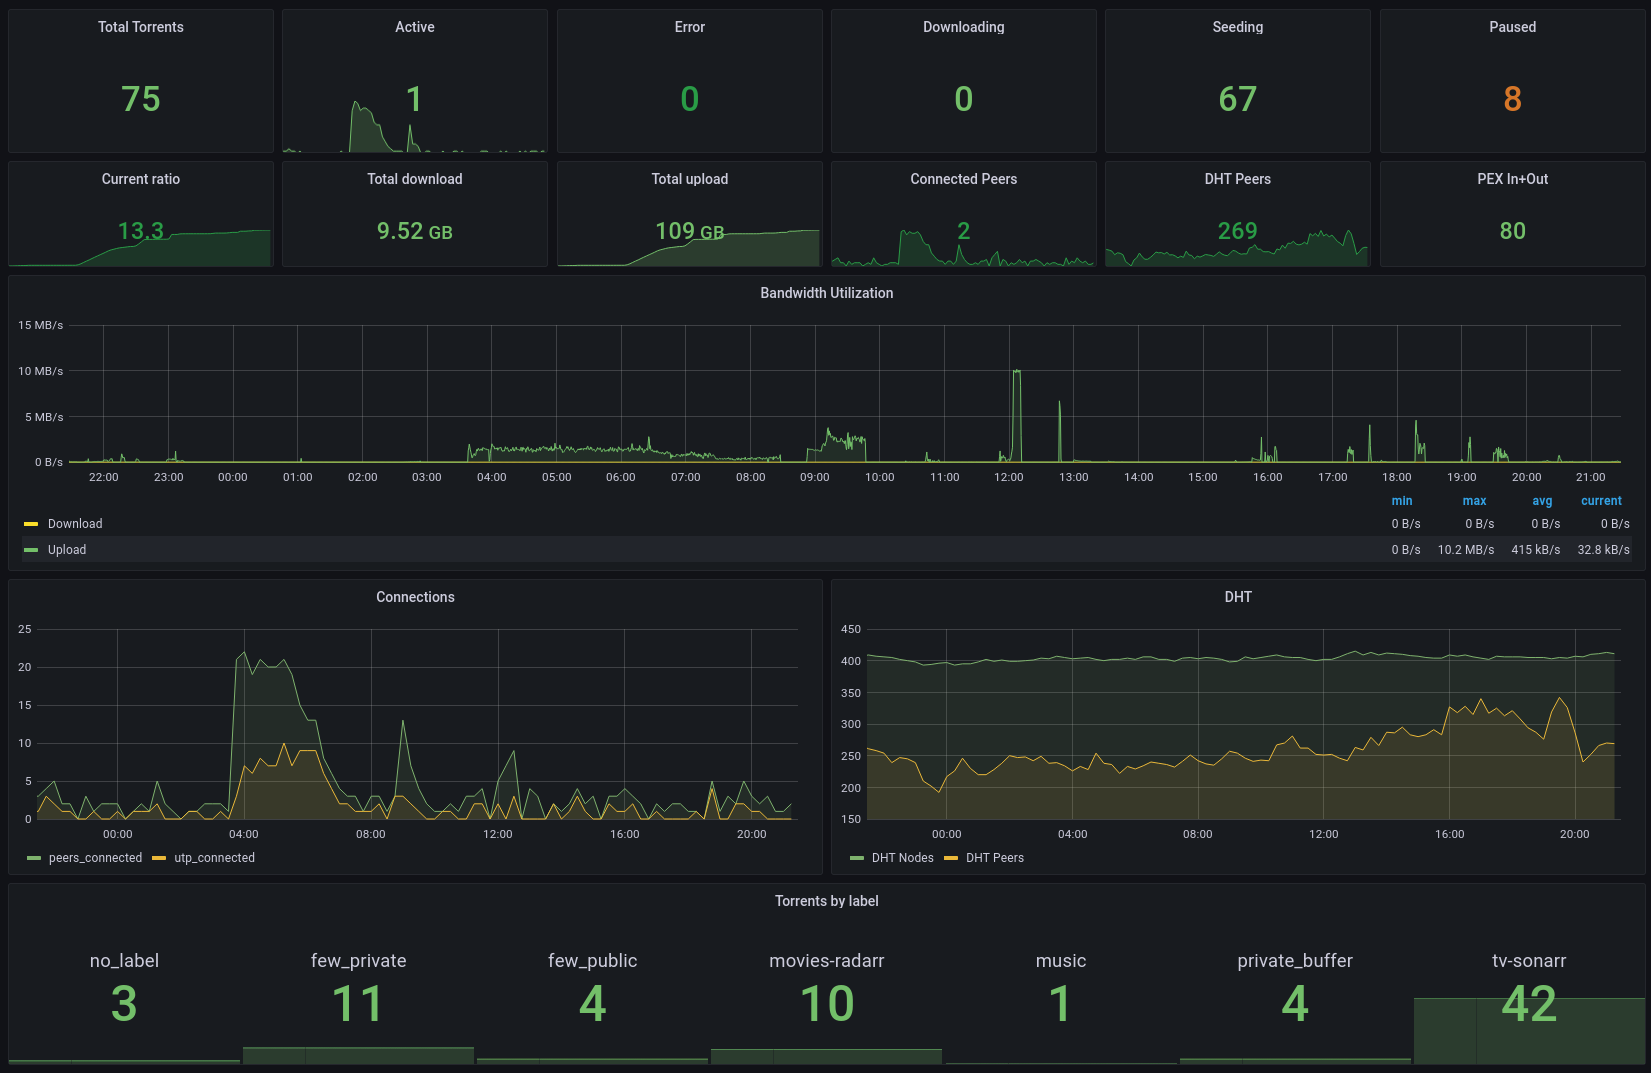
This is my personal Dashboard but I using only a few metrics.
Download and rename as JSON => dash.txt
Here’s mine, focused on discovering stalled torrents.
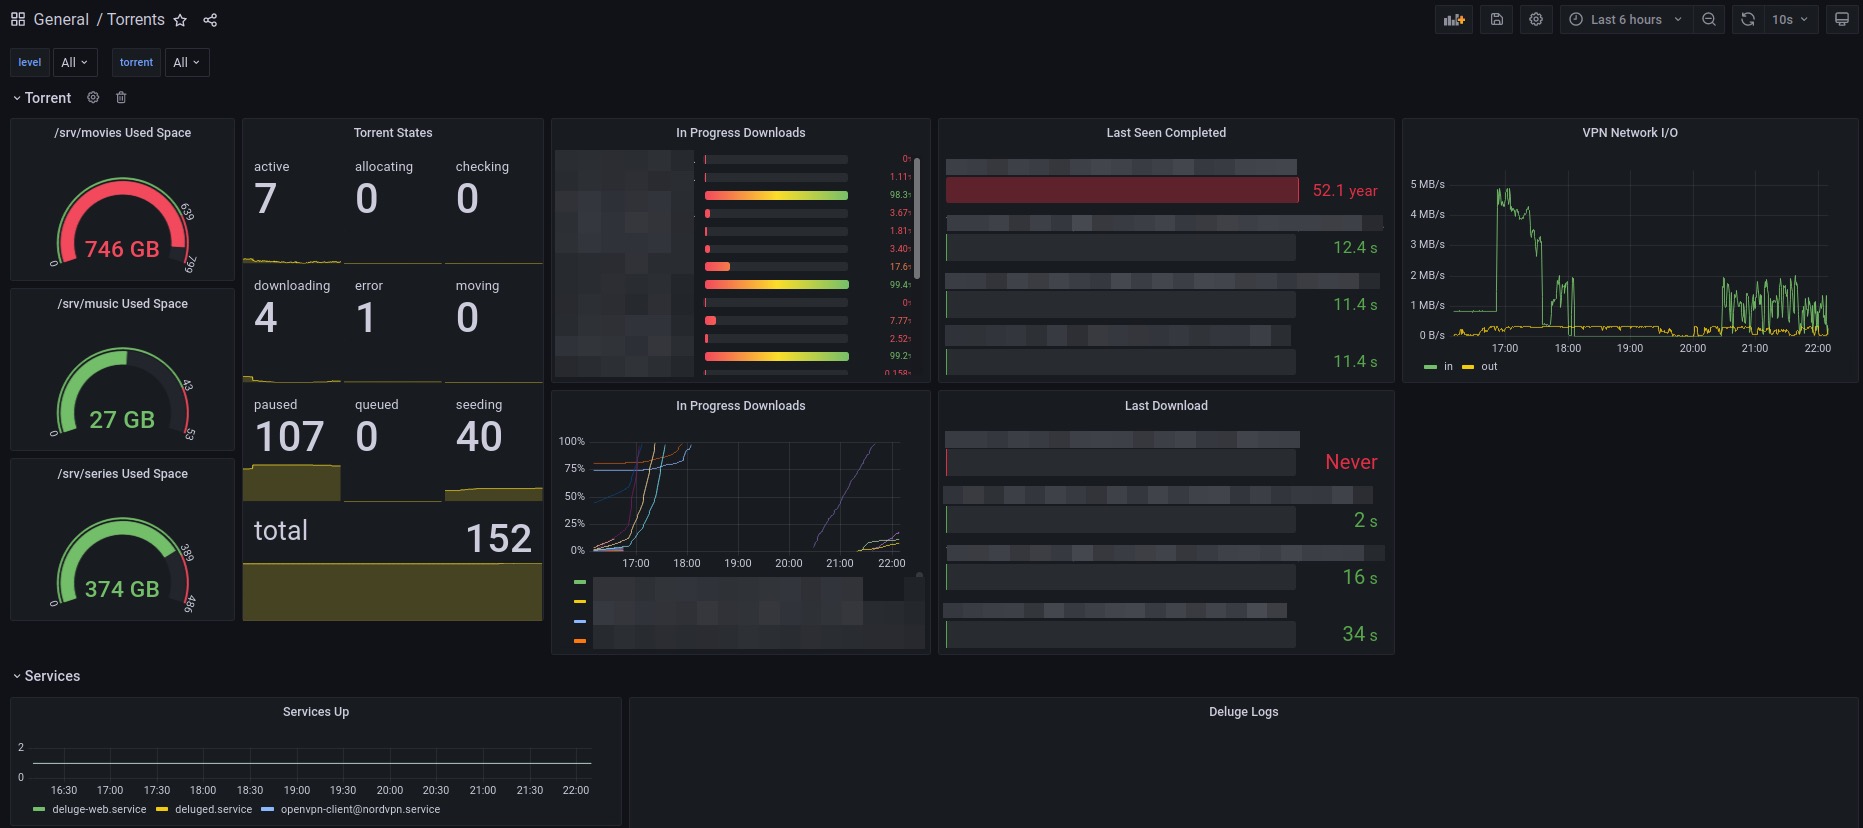
And here’s the dashboard definition https://gist.github.com/ibizaman/e4a79c2e1800a74c25ba3755aa75426a
Note that it needs #17
Not sure if this is completely on-topic but i was hoping someone could help me with an issue in with my metrics
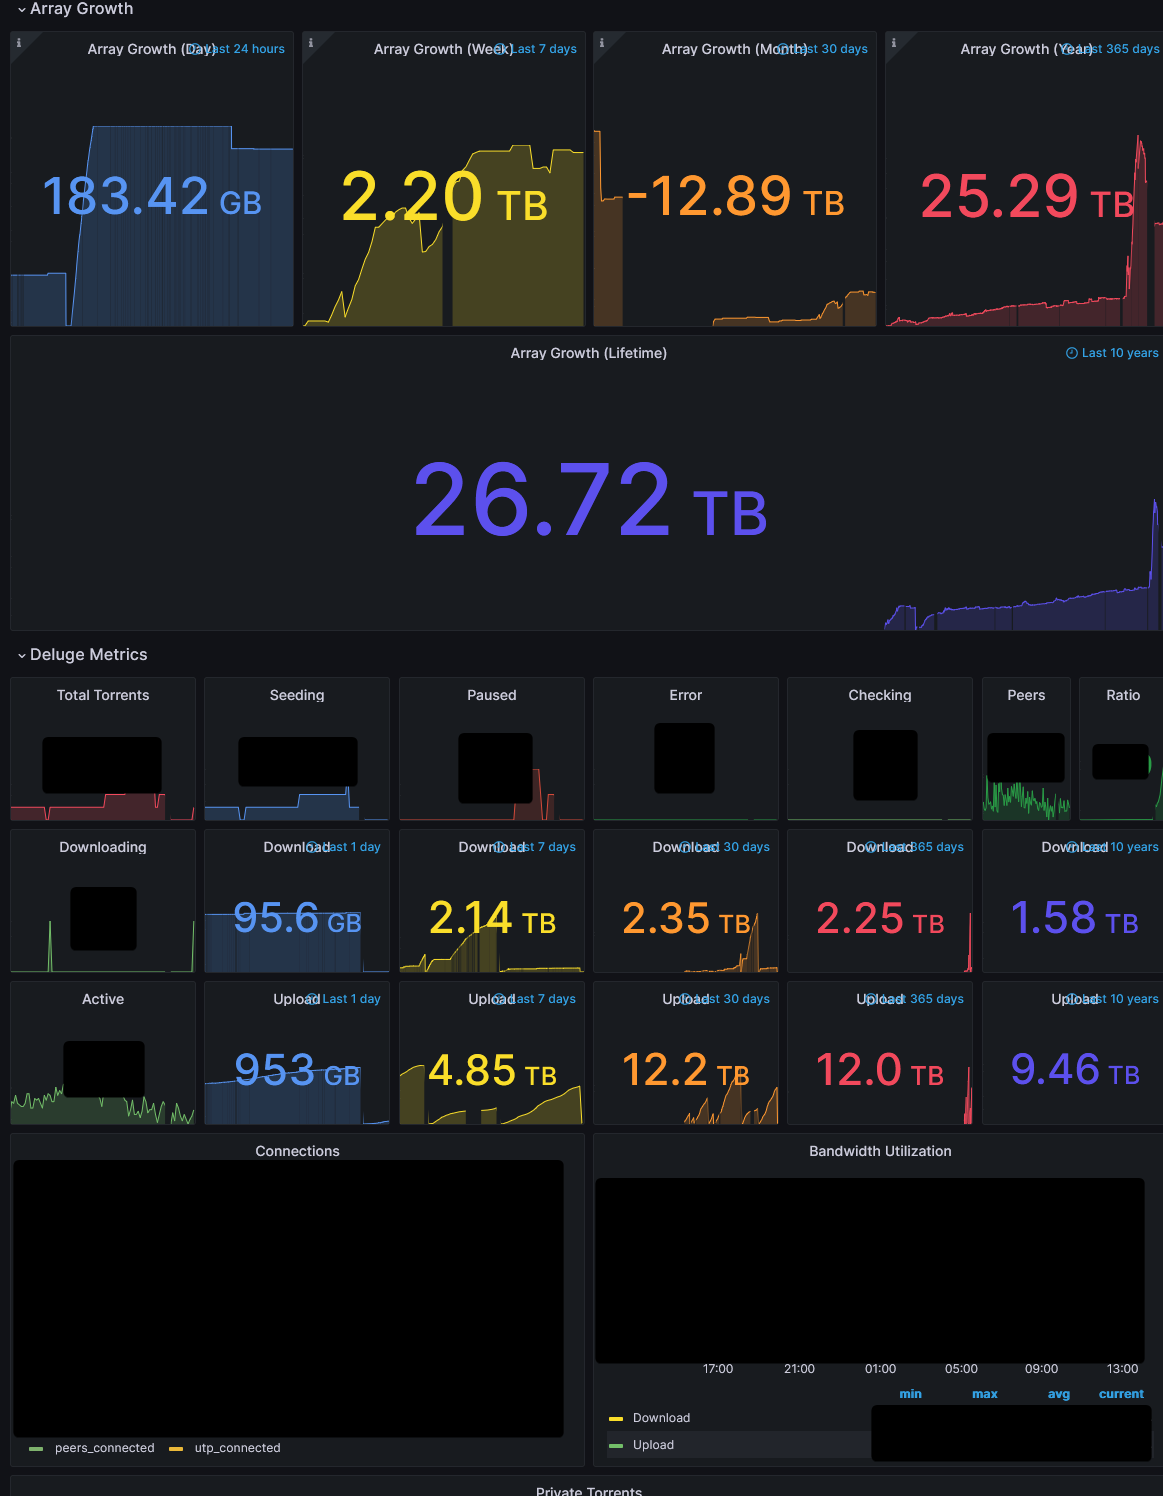
as you can see on the upper part is my array growth over time, and i was hoping i could add similar metrics from deluge, but i'm not quite i'm getting the correct info.
i've currently got the calculation set to "Delta", and relative time as you can see in the title - which seems to show reasonable results.
but as you can see in the boxes for upload specifically its hitting peaks and valleys when i would assume it should only go up and plateau since you cannot "lose" uploaded data
Are all of these metrics session specific for deluge or something?
Also my "10 years" box seem to show less than the "365 days" box which doesn't make any sense either.
delta is only for gauges, and has no handling of counter resets.
You'll want to use increase instead.
In general, Prometheus metrics exposed by services are reported only for the current session, and Prometheus query functions that operate on counters (which are used for monotonically increasing values, such as upload/download in deluge) automatically adjust for counters resetting to 0.