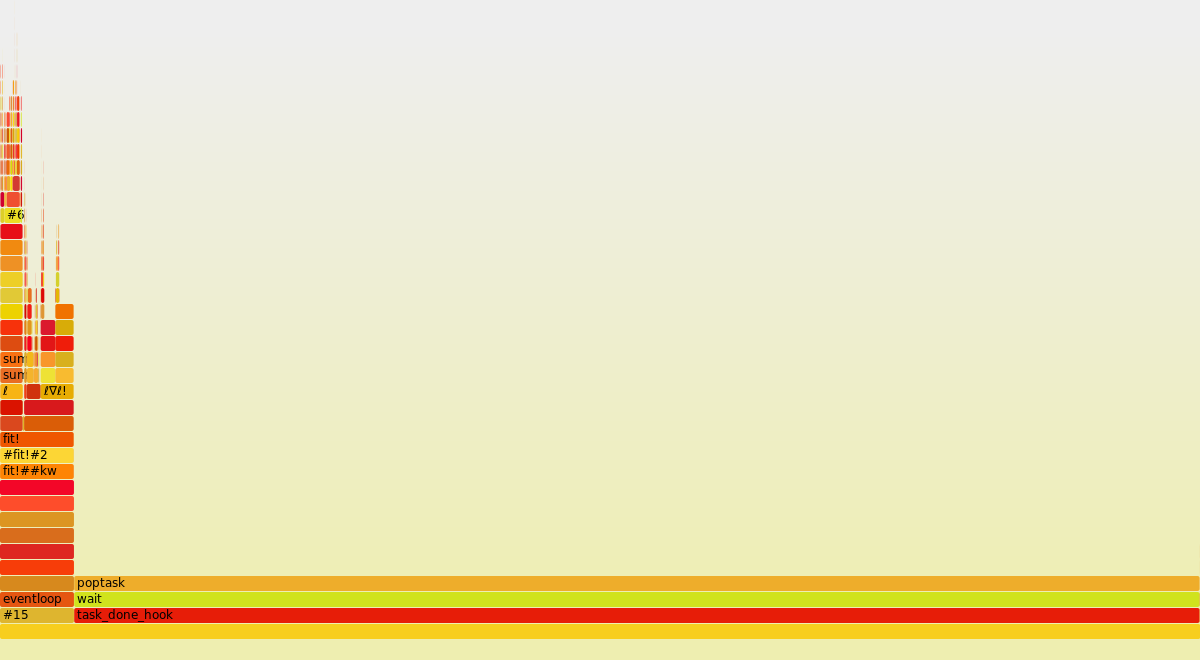
Flame graph produced for a single-threaded computation on a 16-core machine is rather useless
This isn't really a bug, but when I run a single-threaded computation in julia with JULIA_NUM_THREADS=16, I get, e.g., ~200 samples from my own code plus ~3000 samples in the functions poptask/wait/task_done_hook. This is correct in the sense that that is where the samples were taken, but when producing the flame graph all of the space in the graph (15/16=93% of it) is occupied by sleeping threads that were sampled.
There isn't such an issue with printed output from Profile because it is as intrusive, the same samples are just printed at the bottom on three lines.
Would you accept a pull request to optionally filter profiling data by a regexp to remove sleeping threads from the flame graph?
This is what it looks like:
Thanks for highlighting the issue and it seems worth fixing. I'm not sure I'm convinced we should fix it by adding a regex parameter; is there a more direct way to specify what's irrelevant? For example, can we eliminate samples by threadid() in some way, or maybe we can allow the user to pass some filtering callback. Do you have any ideas?
I don't have any good ideas, the regex filter is just a dirty hack I'm using right now because it seems those three functions are the only ones I need to get rid of in my own testing.
Once profiling is done all I have is a Vector{UInt} and a Dict{UInt,LineInfo} so there's not much I can think of to do with that. Filtering by package names or file paths seems like it might drop useful samples.
I was thinking maybe we can unify it with the from_c filter that we already have, so that's somewhere around here:
https://github.com/tkluck/StatProfilerHTML.jl/blob/master/src/Reports.jl#L99
I also think some people might be interested in a positive filter ("only this function") rather than filtering something out.
Once profiling is done all I have is a Vector{UInt} and a Dict{UInt,LineInfo} so there's not much I can think of to do with that.
Maybe we could pass TracePoint objects to a user-supplied callback, or just the native StackFrame?