helm-charts
 helm-charts copied to clipboard
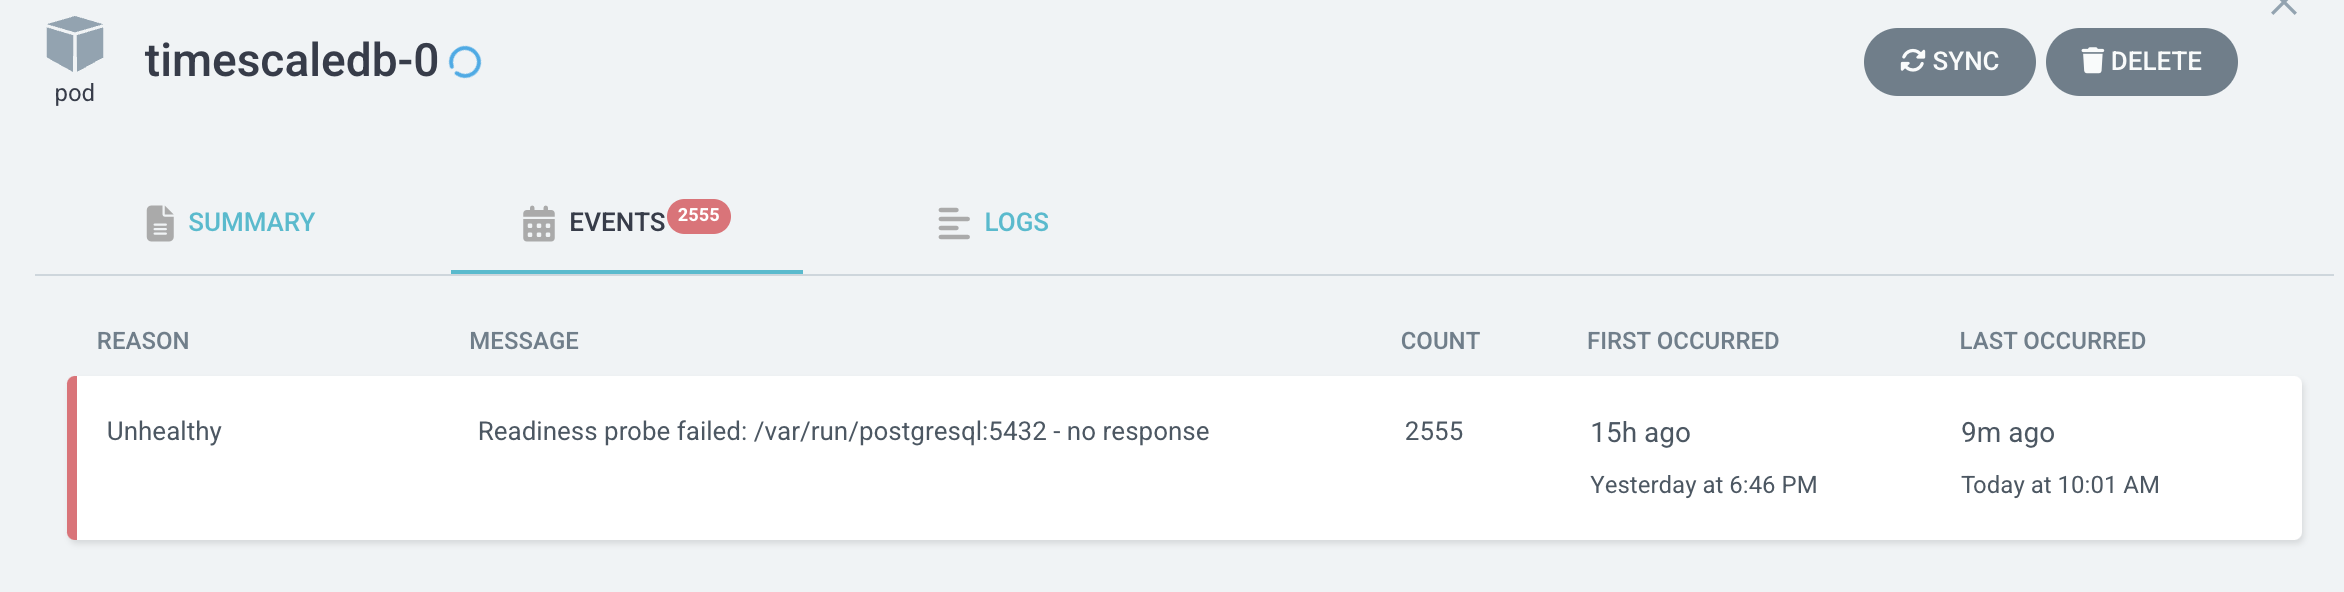
[ISSUE] Postgresql went into not running state
Bug Description We deployed timescale-single non HA and promscale on a production setup on eks (nfs storage without encryption) with default configuration of timescale, certain workload was running on that setup, after a day or two few of the pod on that node restarted. Within those pod timescale also restarted, But when the pod come up again, there was no socket in /var/run/postgresql/.s.PGSQL.5432 in the container In the logs we only able to see.
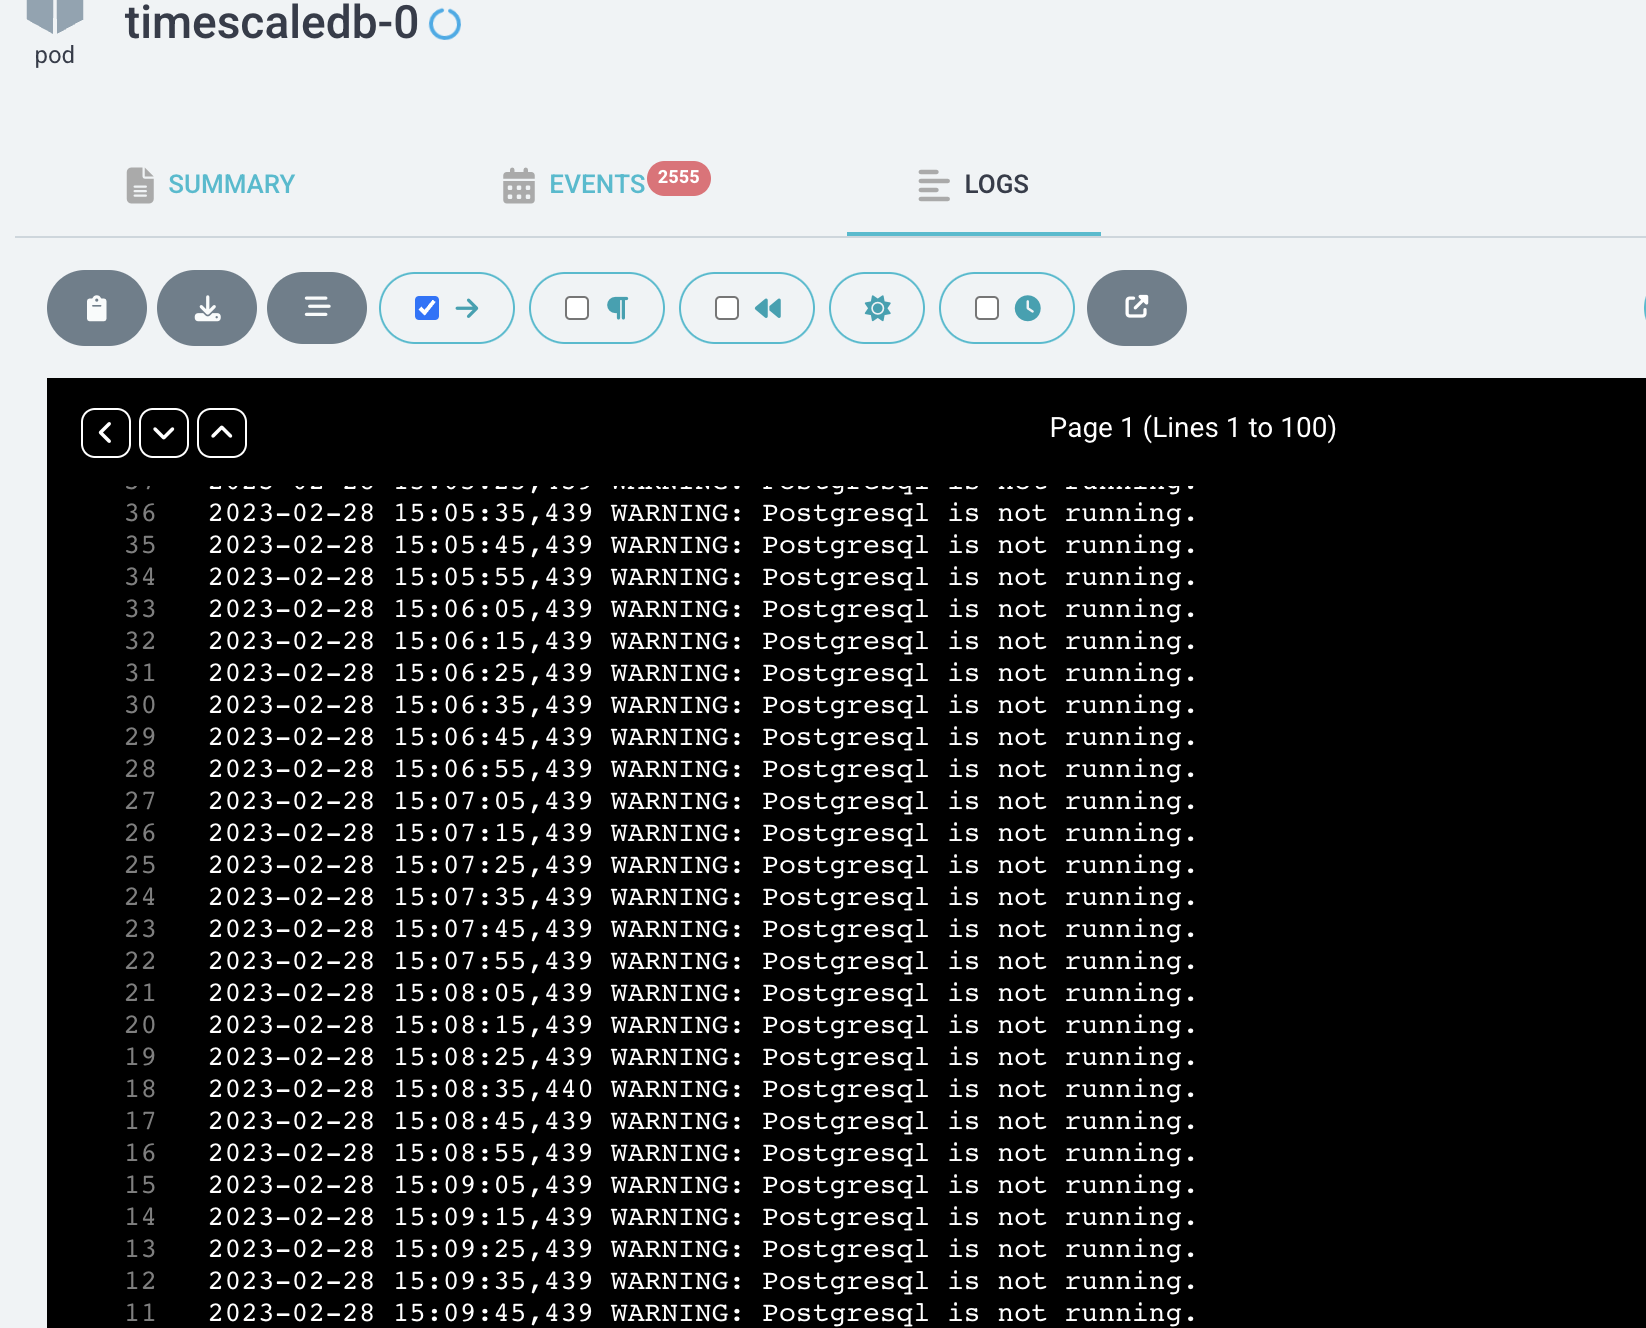
2022-06-21 12:18:11,298 WARNING: Postgresql is not running.
though socket was not there but postgres --single process was running inside the container.
Since promscale was not able to communicate with the DB, we disconnected prometheus and promscale, and after 4-5 hours. Postgres was running up again. We are unable to debug the cause. Need some help on that.
Expected behavior After timescale restarting , postgres should be also running.
Deployment
- What is in your
values.yaml- image: pg13.7-ts2.6.1-p0
- What version of the Chart are you using?
- chart 0.12.0
- What is your Kubernetes Environment (for exampe: GKE, EKS, minikube, microk8s)
- EKS with no encryption
I see lots of BIND SELECT process being created, which is consuming too many FDS on the system. If i try to increase the FD it is not still working as expected
we are facing same issue, any help would be appreciated, the only way to start this is by ssh'ing to the pod and running, patronictl restart timescaledb
#$ cat /etc/timescaledb/patroni.yaml
bootstrap:
  dcs:
    loop_wait: 10
    maximum_lag_on_failover: 33554432
    postgresql:
      parameters:
        archive_command: /etc/timescaledb/scripts/pgbackrest_archive.sh %p
        archive_mode: "on"
        archive_timeout: 1800s
        autovacuum_analyze_scale_factor: 0.02
        autovacuum_max_workers: 10
        autovacuum_naptime: 5s
        autovacuum_vacuum_cost_limit: 500
        autovacuum_vacuum_scale_factor: 0.05
        hot_standby: "on"
        log_autovacuum_min_duration: 1min
        log_checkpoints: "on"
        log_connections: "on"
        log_disconnections: "on"
        log_line_prefix: '%t [%p]: [%c-%l] %u@%d,app=%a [%e] '
        log_lock_waits: "on"
        log_min_duration_statement: 1s
        log_statement: ddl
        max_connections: 100
        max_prepared_transactions: 150
        shared_preload_libraries: timescaledb,pg_stat_statements
        ssl: "on"
        ssl_cert_file: /etc/certificate/tls.crt
        ssl_key_file: /etc/certificate/tls.key
        tcp_keepalives_idle: 900
        tcp_keepalives_interval: 100
        temp_file_limit: 1GB
        timescaledb.passfile: ../.pgpass
        unix_socket_directories: /var/run/postgresql
        unix_socket_permissions: "0750"
        wal_level: hot_standby
        wal_log_hints: "on"
      use_pg_rewind: true
      use_slots: true
    retry_timeout: 10
    ttl: 30
  method: restore_or_initdb
  post_init: /etc/timescaledb/scripts/post_init.sh
  restore_or_initdb:
    command: |
      /etc/timescaledb/scripts/restore_or_initdb.sh --encoding=UTF8 --locale=C.UTF-8
    keep_existing_recovery_conf: true
kubernetes:
  role_label: role
  scope_label: cluster-name
  use_endpoints: true
log:
  level: WARNING
postgresql:
  authentication:
    replication:
      username: standby
    superuser:
      username: postgres
  basebackup:
  - waldir: /var/lib/postgresql/wal/pg_wal
  callbacks:
    on_reload: /etc/timescaledb/scripts/patroni_callback.sh
    on_restart: /etc/timescaledb/scripts/patroni_callback.sh
    on_role_change: /etc/timescaledb/scripts/patroni_callback.sh
    on_start: /etc/timescaledb/scripts/patroni_callback.sh
    on_stop: /etc/timescaledb/scripts/patroni_callback.sh
  create_replica_methods:
  - pgbackrest
  - basebackup
  listen: 0.0.0.0:5432
  parameters:
    temp_file_limit: 20GB
  pg_hba:
  - local     all             postgres                              peer
  - local     all             all                                   md5
  - hostnossl all,replication all                all                reject
  - hostssl   all             all                127.0.0.1/32       md5
  - hostssl   all             all                ::1/128            md5
  - hostssl   replication     standby            all                md5
  - hostssl   all             all                all                md5
  pgbackrest:
    command: /etc/timescaledb/scripts/pgbackrest_restore.sh
    keep_data: true
    no_master: true
    no_params: true
  recovery_conf:
    restore_command: /etc/timescaledb/scripts/pgbackrest_archive_get.sh %f "%p"
  use_unix_socket: true
restapi:
  listen: 0.0.0.0:8008