windContours() : could not find function "windContours"
Dear developers,
I am fairly new to R programming, specially to dealing with packages uploaded to Github. So, maybe this error is caused by lack of experience.
But whenever I try to run windContours() function, I get an error as if the function does not exist. On the other hand, when I ran strip() function I did not get any problem.
My data is already organized as the one available on this link https://metvurst.wordpress.com/2013/03/04/visualising-diurnal-wind-climatologies-2/
I aim to plot the same type of graph available on the above link. Could you help me to do so?
Can you provide the whole code you use? Did you call library(metvurst)?
Dear @tim-salabim , thanks for your quick response!
My data is organized exactly like the data example given in the link above. To test the function, I downloaded the .csv file provided in the example link, and tried running the code. It returned the same error:
library(metvurst) windContours(hour = h,
-
wd = md$Wind.Direction, -
ws = md$Wind.Speed, -
keytitle = "hourly wind frequencies [%]")
Error in windContours(hour = h, wd = md$Wind.Direction, ws = md$Wind.Speed, : could not find function "windContours"
Sorry for that! It seems the function is neither exported nor documented. For now you should be able to use it by explicitly calling it from the package namespace metvurst:::windContours().
I'll try to find some time to provide proper documentation etc
Thanks! I like the idea of a proper documentation, it could help many users! Turns out using metvurst:::windContours() indeed works and calls the function, but now it seems the function requires other function which is not found by R:
metvurst:::windContours(hour = md$h,
-
wd = md$Wind.Direction, -
ws = md$Wind.Speed, -
keytitle = "hourly wind frequencies [%]")
Error in image.smooth(tab.wd, theta = smooth.contours, xwidth = 0, ywidth = 0) : could not find function "image.smooth"
This function comes from the fields package. Make sure you have all packages listed in DESCRIPTION installed and loaded. Sorry for the inconvenience, but no one has used this package in years :-(
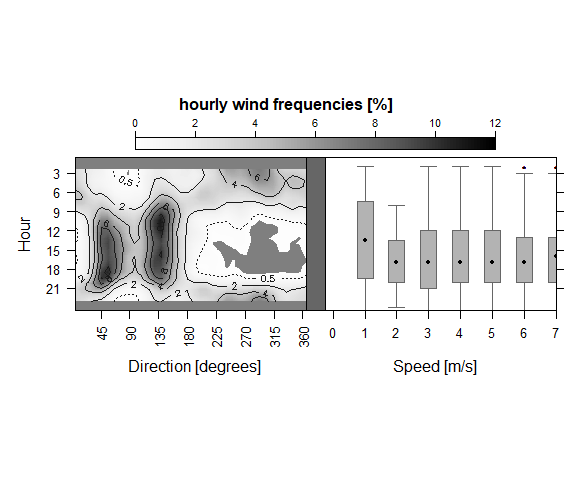
@tim-salabim after installing the packages indicated in the DESCRIPTION, the function works but returns a figure different from what I expected, based on the example in the website above. The boxplots are plotted in function of wind speed instead of an hour of the day, and the frequency plot is somehow out of the center. The problem is I don't know how to set the aesthetics or fix the mentioned issues. What would you recommend? Is there another package I can use to run the same plot and analyses? metvurst has such a nice proposal, I really like its idea!
The openair package has something similar as far as I know but not quite the same. I guess it's time for me to invest a little time and bring the code up to date (the function was written about 15 yrs ago in my very early days of using R). Not sure how long it will take to correct all this though.