caret
 caret copied to clipboard
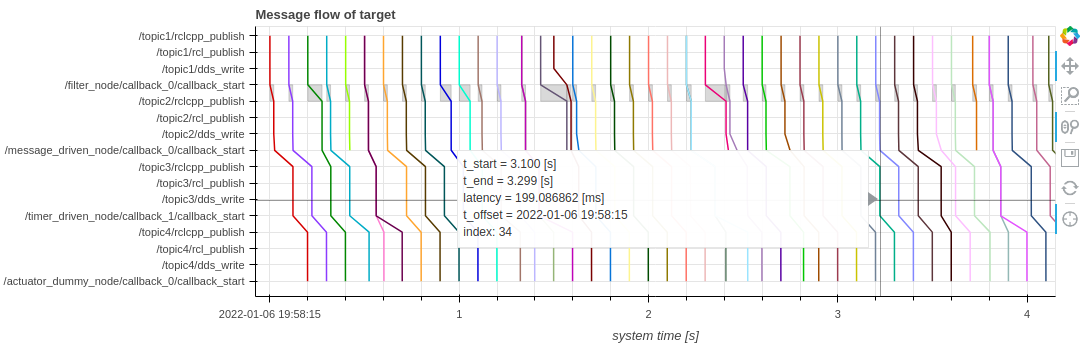
Message flow plot does not show the colored lines
Checklist
- [X] I've read the contribution guidelines.
- [X] I've read document and no solution were found.
Issue type
Help wanted
Step where the issue is related to
Visualization
Environments
- OS: Ubuntu 22.04.3 LTS
- Kernel version: 6.2.0-35-generic
- ROS: Humble
- CPU: 12th Gen Intel(R) Core(TM) i7-1270P x 16
- Memory: 16.0 GiB
- Python version: 3.12.10
CARET version
- CARET: main | cd04e9b
- CARET_analyze: a6bf27af8d85ea8849c64de79ce91ef135c48cb3
- CARET_trace: a07d15b008aacb7fcc5d521d938330c7c37f3442
Target application
- Application name: caret_demos
- URL: https://github.com/tier4/caret_demos
- Version: 1fc6f5f
Description
Hi Team.
I'm following the tutorial in CARET's documentation and the outcome after showing the message flow plot is not what I expected. Next, I attach the plot I obtained.
And the plot I should have obtained.
I already read the FAQs and applied all the corrections to solve the known issues. Both CARET and the application are built without errors. I checked that the application is built using caret-rclcpp and that the generated traces are valid, with the commands shown in the tutorial.
Steps to reproduce
Follow step by step the instructions here, first Recording, then Configuration and finally Visualization.
Commands
No response
Logs
No response
LTTng trace log file
No response
Screenshots
No response
Hi @m-alcon.
It appears that the graph is brolen in the DDS layer.
Depending on the version of DDS you are using, it may not be able to output the necessary trace points. This issue has been resolved in the latest CARET. Please update your workspace and try the measurement again.
Also, could you please let us know which DDS version you are currently using? We may be able to provide assistance.
Hi @ymski.
I updated CARET and tried the measurement again, and when trying to visualize the traces with create_message_flow_plot the following error arises.
BokehUserWarning: out of range integer may result in loss of precision
... # the message is repeated a lot of times
BokehUserWarning: out of range integer may result in loss of precision

Javascript Error: e is undefined
Before visualizing, I checked that the traces are OK with ros2 caret check_ctf.
I'm using ros-humble-cyclonedds, version 0.10.3-1jammy.20230822.172333.
Thank you for the detailed report. @m-alcon
There could be several reasons for the issues you've mentioned.
First, it appears to be related to CycloneDDS. In CARET, we embed tracepoints by hooking into specific functions. For CycloneDDS v0.10.x, the symbols of the functions you want to hook may be hidden, so we have made modifications for CARET's use. Please check if CycloneDDS is located under ~/ros2_caret_ws/src. If you are trying to use the CycloneDDS installed via apt, you might face issues with graph rendering.
Secondly, there might be a potential issue with the proper update of the CARET workspace. Updating the CARET workspace should be done by running setup_caret.sh last. Please double-check this.
Warnings mentioned in report:
-
Javascript Error e is undefined
- This is an error that developers don't encounter often. It might be resolved by restarting Jupyter Lab.
-
BokehUserWarning: out of range integer may result in loss of precision
- This warning doesn't directly affect the ability to render graphs. You can probably safely ignore it for this case.
Finally, if necessary, please share the trace data and analysis scripts. It's possible to differentiate whether the issue lies in the data acquisition or the graph rendering.
Hi @ymski.
I'm using CycloneDDS installed via apt, so the problem could be this one. At least so far, I'm not specially interested in using any particular DDS, so I can use CARET with the one that better works.
Regarding running setup_caret.sh, I cannot use it. I installed all the dependencies using the manual installation. The error I got when running the script is the following.
[WARNING]: No inventory was parsed, only implicit localhost is available
[WARNING]: provided hosts list is empty, only localhost is available. Note that the implicit localhost does not match 'all'
Would you like to install the require packages[y/n] [y]: y

PLAY [localhost] **************************************************************************************************************************************************************************************************

TASK [Gathering Facts] ********************************************************************************************************************************************************************************************
ok: [localhost]

TASK [Verify OS] **************************************************************************************************************************************************************************************************
fatal: [localhost]: FAILED! => {"changed": false, "msg": "Only Ubuntu 22.04 is supported for this branch. Please refer to https://tier4.github.io/caret_doc/latest/installation/installation/"}

PLAY RECAP ********************************************************************************************************************************************************************************************************
localhost                  : ok=1    changed=0    unreachable=0    failed=1    skipped=0    rescued=0    ignored=0

Failed.
The problem is that I'm already using Ubuntu 22.04.3 LTS. I think there is something misconfigured in my computer since this is what I get after calling lsb_release -a.
No LSB modules are available.
Distributor ID:	Ubuntu
Description:	Ubuntu 22.04.3 LTS
Release:	20.04
Codename:	jammy
The description and codename matches the version but not the release. At the moment I don't plan to reinstall Ubuntu on my computer.
Here you have the trace data, and the analysis script is just the one shown in CARET's tutorial.
Thank you very much for all your help.
Hi @m-alcon .
Thank you for sharing the data.
I checked the trace data.
The trace points (= dds_bind_addr_to_stamp) required by the DDS layer were not output. (see doc)
If you are not concerned about a specific DDS, try using FastDDS. The problem of FastDDS not outputting tracepoints is not confirmed at this time.
@m-alcon Since we have not received a response for a long time and the status of the issue is unknown, we are closing it. If you encounter similar problems in the future using the method shown here, please create another issue.