fable
 fable copied to clipboard
Fitting multiple models with a loop
I am currently in a scenario where I need to fit multiple models where I just change one of the parameters.
library(fpp3)

gas <- us_gasoline %>% filter(year(Week) <= 2004)
gas %>% autoplot(Barrels)
fit <- gas %>%
  model(
    fourier1 = TSLM(Barrels ~ trend() + fourier(K = 1)),
    fourier2 = TSLM(Barrels ~ trend() + fourier(K = 2)),
    fourier3 = TSLM(Barrels ~ trend() + fourier(K = 3)),
    fourier4 = TSLM(Barrels ~ trend() + fourier(K = 4)),
    fourier5 = TSLM(Barrels ~ trend() + fourier(K = 5)),
    fourier6 = TSLM(Barrels ~ trend() + fourier(K = 6)),
    fourier7 = TSLM(Barrels ~ trend() + fourier(K = 7)),
    fourier8 = TSLM(Barrels ~ trend() + fourier(K = 8)),
    fourier9 = TSLM(Barrels ~ trend() + fourier(K = 9))
  )
I would like to have a loop from 1 to n and create a model definition for each of the values of K that I would then feed to the function model. I would like to store the model definitions in a dictionary (list) where I would have separately the model name and the model itself.
Thus far I have been able to create single model formuas and feed them to the function model in a successful manner:
form <- as.formula("Barrels ~ trend() + fourier(K = 1)")
mod <- TSLM(form)

gas %>%
  model(
    mod
  )
My goal would be to have a set of model definitions created in a loop and stored in a list, which I would then feed to the function model as arguments
# Create model definitions
mods <- list()
for (i in seq(1, 9)) {
  form <- paste0("Barrels ~ trend() + fourier(K = ", as.character(i), ")")
  mods[[paste0("model_name_", as.character(i))]] <- TSLM(form)
}
In python I would use list unpacking or dict unpacking to achieve this, but I fail to attain this in R. People suggest using do.call() but I fail to do this...
Could anybody please help?
Hey @juan-g-p!
The following code works,
library(fpp3)
gas <- us_gasoline %>% filter(year(Week) <= 2004)
mods <- list()
for (i in seq(1, 9)) {
mods[[paste0("model_name_", as.character(i))]] <- TSLM(Barrels ~ trend() + fourier(K = i))
}
my_model <- function(...){
model(gas, ...)
}
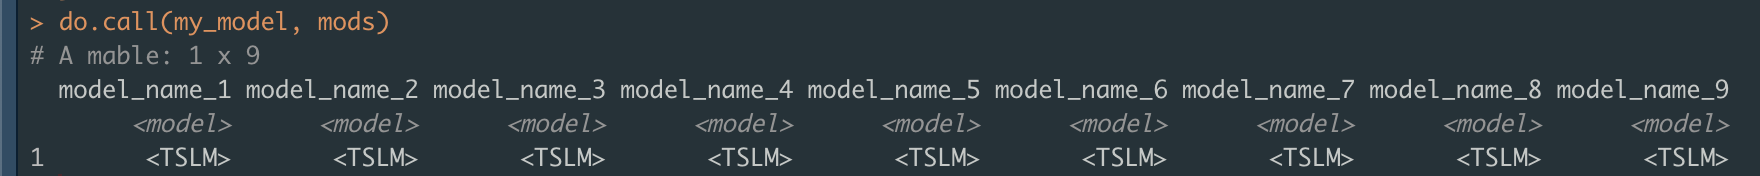
do.call(my_model, mods)
The output is,
A tidier approach,
library(fpp3)
gas <- us_gasoline %>% filter(year(Week) <= 2004)
mods <- list()
for (i in seq(1, 9)) {
mods[[paste0("model_name_", as.character(i))]] <- TSLM(Barrels ~ trend() + fourier(K = i))
}
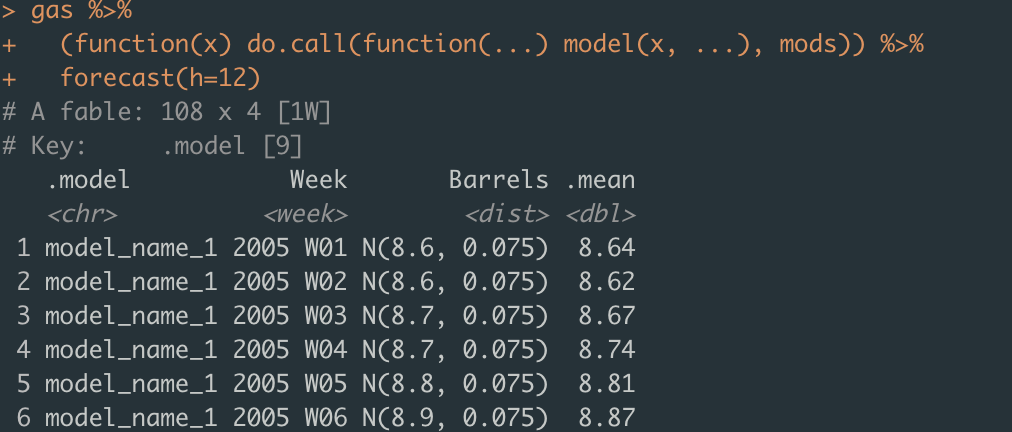
gas %>%
(function(x) do.call(function(...) model(x, ...), mods)) %>%
forecast(h=12)
The output is,
Hello Federico,
Thanks a lot. The code does indeed work. Thanks a lot for taking the time to solve this!
I find however Rs syntax gets overly complicated. I love this library and find it provides an awesome framework, but I must admit sometimes the syntax for doing what should be a very simple task gets quite counter-intuitive.
In any case, thanks again for the help! Very much appreciated!
Here's how I would do it. I like to use map()/lapply() instead of for loops, but either should be okay.
Note that model(<tsibble>, !!!definitions) is how you would splice a list of model definitions.
library(fpp3)
#> ── Attaching packages ──────────────────────────────────────────── fpp3 0.4.0 ──
#> ✔ tibble      3.1.8          ✔ tsibble     1.1.2
#> ✔ dplyr       1.0.10         ✔ tsibbledata 0.4.1
#> ✔ tidyr       1.2.0          ✔ feasts      0.3.0
#> ✔ lubridate   1.8.0          ✔ fable       0.3.2.9000
#> ✔ ggplot2     3.3.6
#> ── Conflicts ───────────────────────────────────────────────── fpp3_conflicts ──
#> ✖ lubridate::date()    masks base::date()
#> ✖ dplyr::filter()      masks stats::filter()
#> ✖ tsibble::intersect() masks base::intersect()
#> ✖ tsibble::interval()  masks lubridate::interval()
#> ✖ dplyr::lag()         masks stats::lag()
#> ✖ tsibble::setdiff()   masks base::setdiff()
#> ✖ tsibble::union()     masks base::union()

# Prepare the models for 1-9 harmonics
harmonics <- seq_len(9)
models <- lapply(harmonics, function(i) TSLM(Barrels ~ trend() + fourier(K = i)))

# Give the models names
names(models) <- paste0("K", harmonics)

# Estimate the models
gas <- us_gasoline %>% filter(year(Week) <= 2004)
fit <- gas %>%
  model(!!!models)

# Compare the forecasts
fit %>%
  forecast(h = "1 year") %>%
  autoplot(filter(us_gasoline, year(Week) %in% 2003:2005), alpha = 1/3)

Created on 2022-10-07 by the reprex package (v2.0.1)
Hello Mitchell,
Thanks a lot for your interesting answer. Both of them are pieces of code I will add to my arsenal.