googlesheets4
 googlesheets4 copied to clipboard
Design question: other types of sheets API requests and access to CellData manipulation
I am finding myself in a need of accessing the lower-level sheets API functions. Core functionalities of googlesheets4 are based on operation of tabular data.frame data. I guess it is a design choice?
I find myself more in need of cell manipulation and range data access.
Basically, the functionalities I need are regarding:
- manipulation
CellDataeg. styling cells - creation of merged cells (
mergeCellsrequest) - creation of googlesheets charts (
addChartrequest)
I've sucessfully created wrappers around these functionalities, and I am now pondering: is there a plan to incorporate these kinds of operations in googlesheets4 (I would be happy to join up on these with PRs!), or should I develop another package? As I am finding these kind of functionaties hard to incorporate into tabular and dplyr-y design.
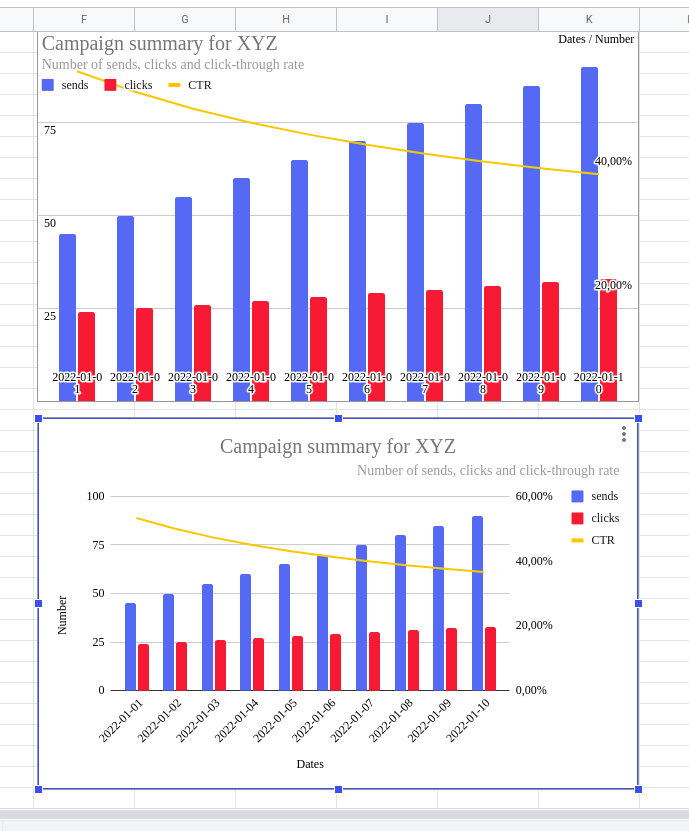
To show what I mean: to create the chart it would be required to access CellRange level and develop few more structs to keep it all clean:
# create cell ranges to point to a data
datesRange <- CellRange(
  sheetId = 0,
  startRowIndex = 0,
  endRowIndex = 1,
  startColumnIndex = 1,
  endColumnIndex = 12
)

sentRange <- CellRange(
  sheetId = 0,
  startRowIndex = 1,
  endRowIndex = 2,
  startColumnIndex = 1,
  endColumnIndex = 12
)

clicksRange <- CellRange(
  sheetId = 0,
  startRowIndex = 2,
  endRowIndex = 3,
  startColumnIndex = 1,
  endColumnIndex = 12
)

CTRRange <- CellRange(
  sheetId = 0,
  startRowIndex = 3,
  endRowIndex = 4,
  startColumnIndex = 1,
  endColumnIndex = 12
)

# specify `BasicChart` with axis, domains and series components
basicChartSpec <- BasicChartSpec(
  chartType = "COMBO",
  legendPosition = "RIGHT_LEGEND",
  axis = list(
    BasicChartAxis("Number",
                   "LEFT_AXIS"),
    BasicChartAxis("Percentage",
                   "RIGHT_AXIS"),
    BasicChartAxis("Dates",
                   "BOTTOM_AXIS")
  ),
  domains = list(
    BasicChartDomain(
      datesRange
    )
  ),
  series = list(
    BasicChartSeries(
      cellRange = sentRange,
      targetAxis = "LEFT_AXIS",
      type = "COLUMN"
    ),
    BasicChartSeries(
      cellRange = clicksRange,
      targetAxis = "LEFT_AXIS",
      type = "COLUMN"
    ),
    BasicChartSeries(
      cellRange = CTRRange,
      targetAxis = "RIGHT_AXIS",
      type = "LINE"
    )
  ),
  headerCount = 1
)

# create ChartSpec object
chartSpec <- ChartSpec(
  chart = basicChartSpec,
  title = "Campaign summary for XYZ",
  titlePosition = "CENTER",
  subtitle = "Number of sends, clicks and click-through rate",
  subtitlePosition = "RIGHT",
  fontName = "Exo",
  maximized = FALSE
)

# and wrap it around in AddChartRequest
chartRequest <- AddChartRequest(
  chartSpec = chartSpec,
  embeddedObjectPosition = EmbeddedObjectPosition(
    type = "anchor",
    sheetId = 0,
    rowIndex = 14,
    columnIndex = 14
  )
)

# Afterwards: send it out to create the charts:
gen_request <- googlesheets4::request_generate(
  endpoint = "sheets.spreadsheets.batchUpdate",
  params = list(
    spreadsheetId = "1yTJKa-EsVSEk6oNvdw7X7uxZ8vXySuCzEI0gWDbW1Po",
    requests = list(
      chartRequest
    )
  )
)

resp <- googlesheets4::request_make(
  gen_request
)
With that kind of code I am able to create charts based on existing data in spreadsheet (one with basicChartRequest$maximize = TRUE):