geom_histogram and color="white" hide x-axis with themes using white background
I've been making some histograms and was puzzled by the appearance of the x-axis. I finally narrowed it down, and it's my combination of color="white" and theme_minimal(). I think the issue is more generalized:
- impacts themes using a white background
- I suspect it affects all bar geoms, not just histograms
- setting
color="white"must plot a zero height bar, which results in blanking out that section of the x-axis
This could be intended... but in my opinion it would be more expected if the grid line were drawn on top of/instead of the bottom white boundary around bars.
# load libraries, and add a high mpg row so we get some gaps between bars
library(dplyr)
library(ggplot2)

mtcars2 <- mtcars %>%
  add_row(mpg = 50)
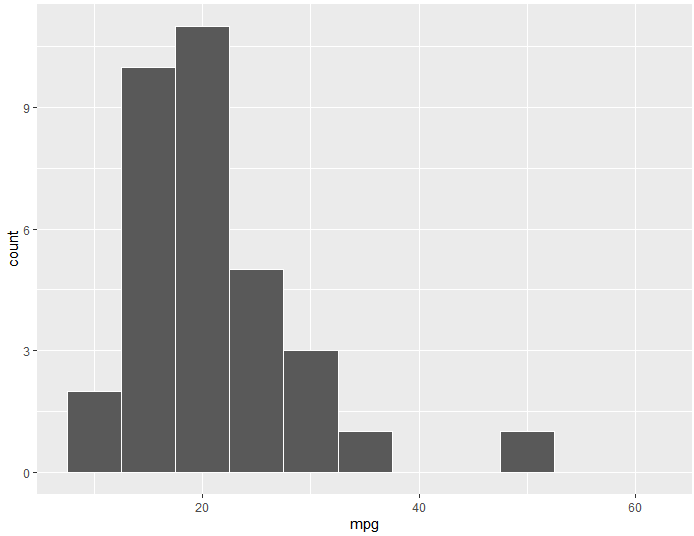
With a default plot, the issue isn't noticeable as the border color and x-axis grid line are both white:
ggplot(mtcars2, aes(x = mpg)) +
  geom_histogram(binwidth = 5, color="white") +
  expand_limits(x = 60)
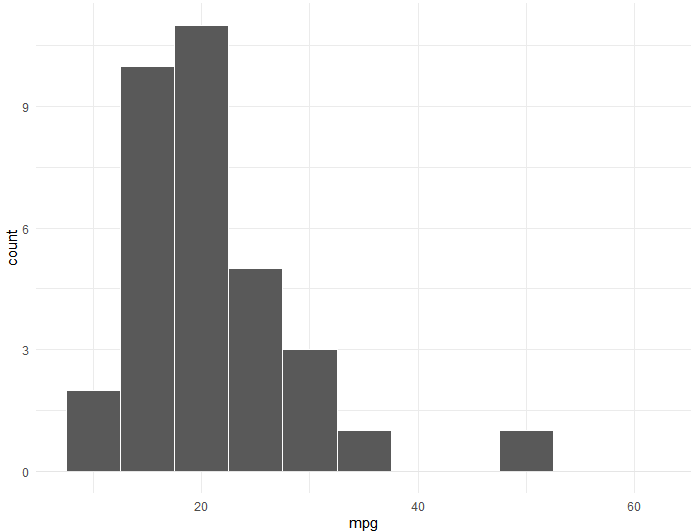
When applying theme_minimal() however, the now-black grid line is hidden by the bar outline:
ggplot(mtcars2, aes(x = mpg)) +
  geom_histogram(binwidth = 5, color="white") +
  expand_limits(x = 60) +
  theme_minimal()

Again, maybe this is expected/known/user-beware... but I still wanted to raise as it surprised me and I don't think it looks good.
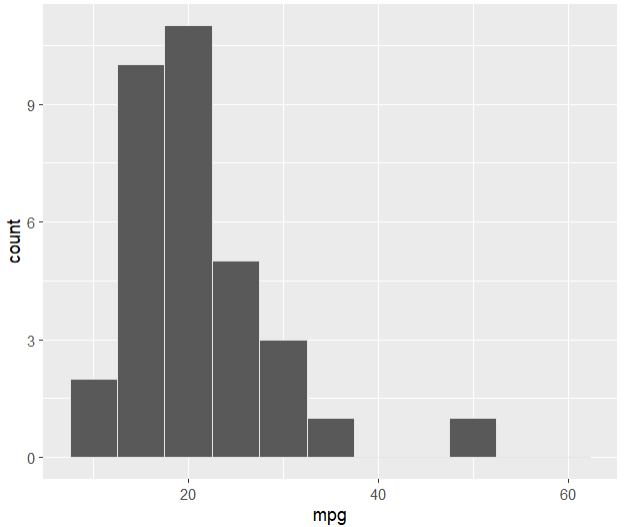
I probably could chase this down in the code, but with a few guesses, I found that adding a grey90 colored geom_hline() works:
ggplot(mtcars2, aes(x = mpg)) +
  geom_histogram(binwidth = 5, color="white") +
  expand_limits(x = 60) +
  geom_hline(yintercept=0, color="grey90") +
  theme_minimal()
There is not much to do on the ggplot2 side and it isn't really a bug. The bars in from histogram has a white outline to better separate them but this outline can also obscure the grid lines and if the background is the same colour as the outline it can look like it disappears
I agree with Thomas on this, I think everything works as intended here. Even though it is unlikely that ggplot2 is going to change this, I still would like to thank you for the care you've taken to report the issue and hope that we'll hear from you again if you find another issue.
Thanks for taking a look @thomasp85 and @teunbrand . Understood, and honestly in re-looking at this... it took me a minute to parse what I thought the initial problem actually was. I can see it either way. You know, in devil's advocating with myself as well... I do see it's not apples to apples. I'm using color = "white" in both cases... but in only the theme_minimal case is that also the background color.
This would be apples to apples, and is consistent:
ggplot(mtcars2, aes(x = mpg)) +
  geom_histogram(binwidth = 5, color = "gray90")
  expand_limits(x = 60)
Edits: oops, actually it'a some other gray, but CloseEnough to illustrate.
you can explicitly remove the zero-count bars if you wish so
library(dplyr)
#>
#> Attaching package: 'dplyr'
#> The following objects are masked from 'package:stats':
#>
#>     filter, lag
#> The following objects are masked from 'package:base':
#>
#>     intersect, setdiff, setequal, union
library(ggplot2)
library(patchwork)

mtcars2 <- mtcars %>%
  add_row(mpg = 50)

a <- ggplot(mtcars2, aes(x = mpg)) +
  geom_histogram(binwidth = 5,
                 color = "red",
                 aes(y = after_stat(count))) +
  expand_limits(x = 60)

b <- ggplot(mtcars2, aes(x = mpg)) +
  geom_histogram(binwidth = 5, color = "red",
                 aes(y = ifelse(
                   after_stat(count) > 0, after_stat(count), NA
                 ))) +
  expand_limits(x = 60)

a + b
#> Warning: Removed 4 rows containing missing values (`position_stack()`).

Created on 2023-01-09 with reprex v2.0.2
You're surpassing my knowledge @smouksassi . Seeing the after_count() reminds me of waiting for something like a dentist appt and skimming some of these newer features that were announced some time ago, but I haven't dug in to understand.
Thanks for the inspiration/nudge/example :)