Feature Request: Positional Scales `$map` method to return `NULL` when `x` is empty
The Feature Request
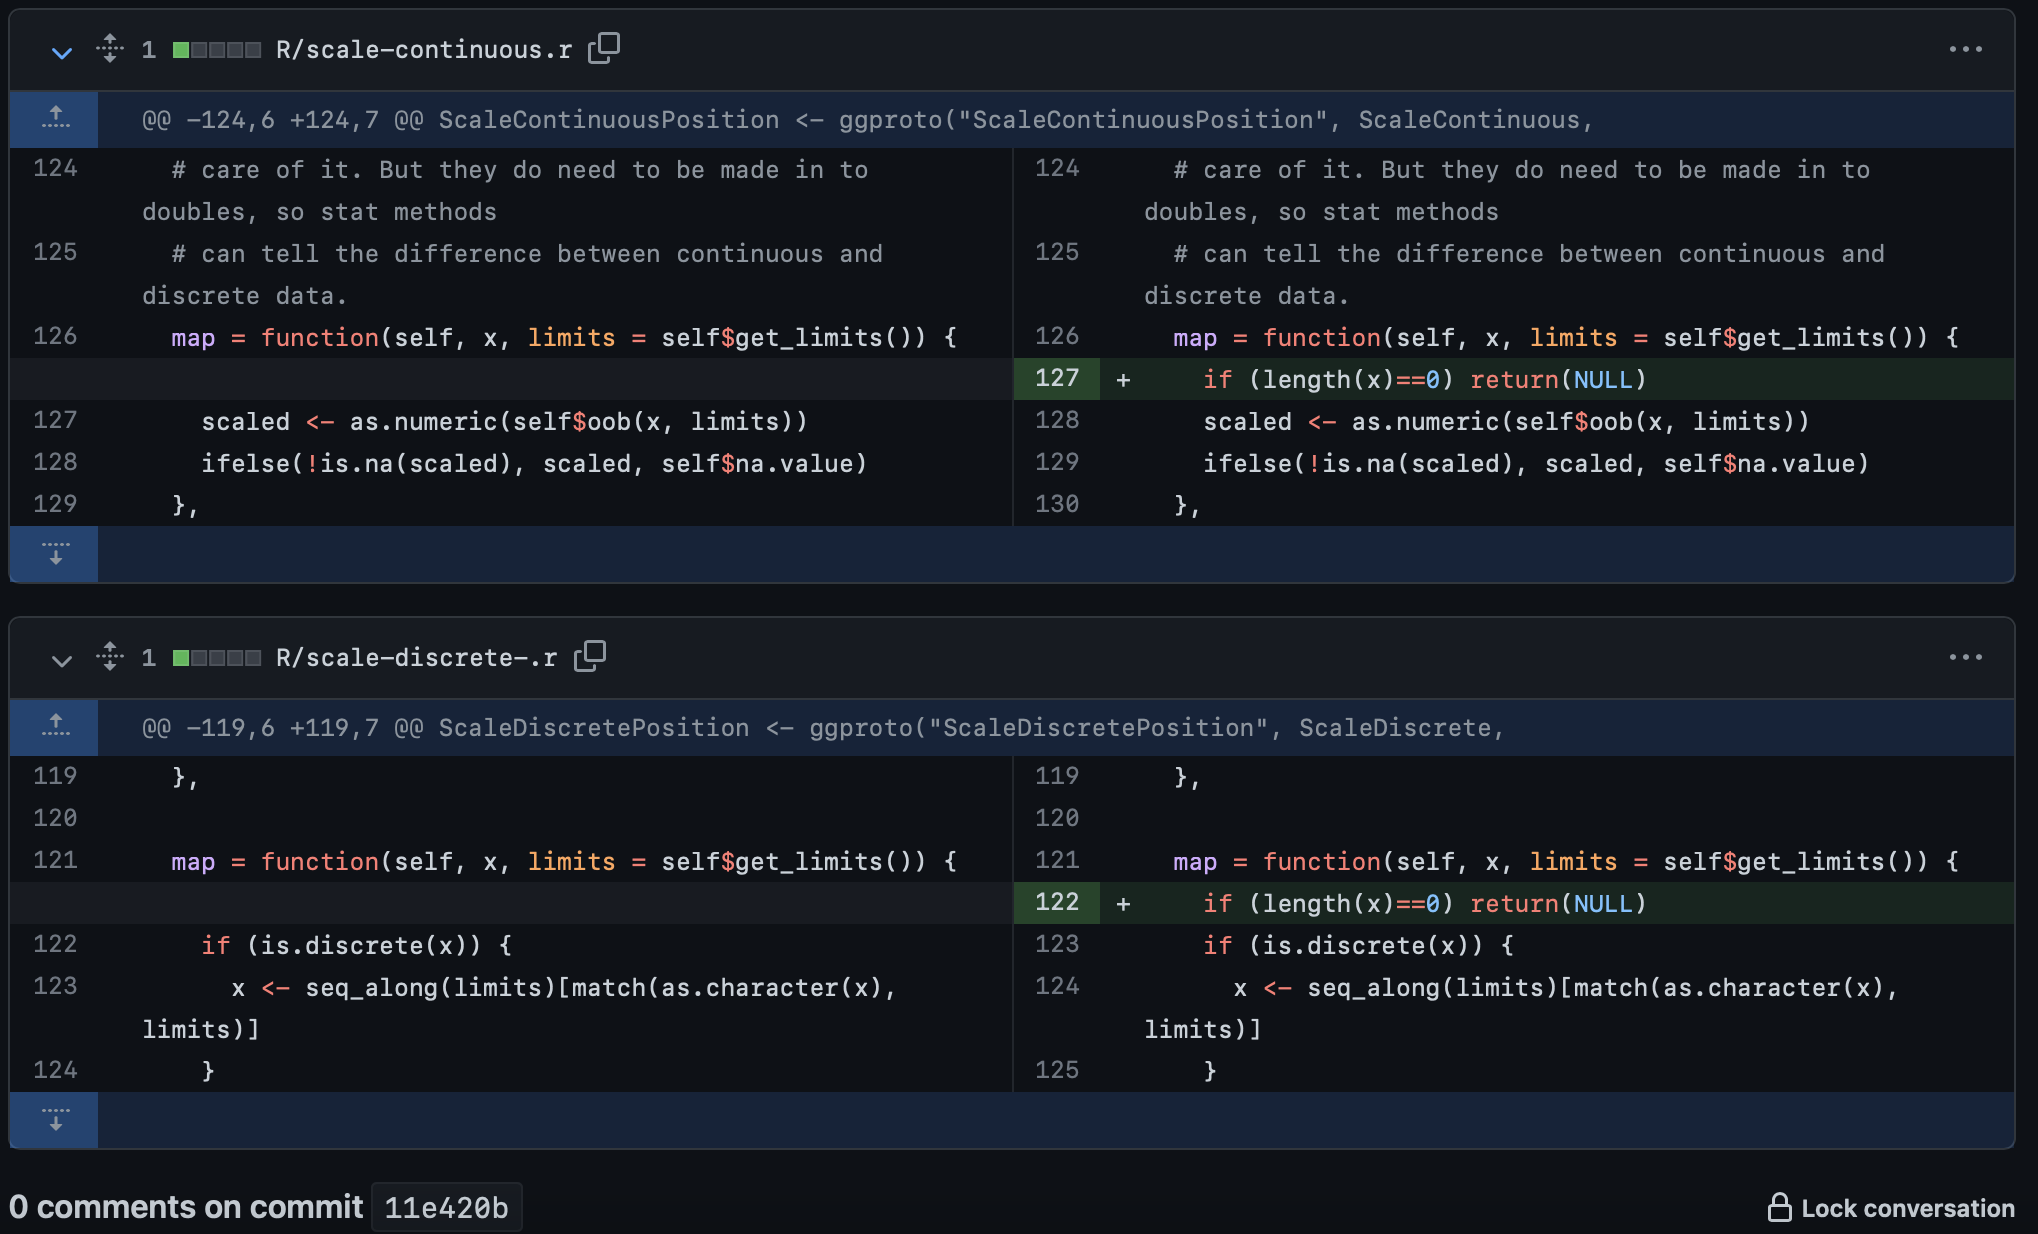
Simply return NULL from the Positional Scales ggproto $map methods if the x has a length of 0 (i.e. no data from the layer is associated with said scale). (The relevant execution of this code is seen in scale_apply)
With the impending release of ggplot2 v3.4.0 a lot of changes are coming that may affect downstream dependencies compatibilities. I understand that the developers of ggplot2 may introduce breaking changes, but I do believe this minor change would have very little impact on package as a whole.
Justification
With the implementation of vec_c and the new ggplot2_mapped_discrete class, ggplot2 will potentially coerce layer data types into ggplot2_mapped_discrete causing certain stat methods to fail due to a generic not yet implementing a method to handle the data.
Generally speaking, ggplot2 would normally not ever encounter this problem, as the x or y scales per panel are usually the same type, either continuous or discrete. Downstream dependencies however have been known to try and customize the scales object to allow for the mixing of positional scales.
One such example is the ggside package - in which "side" panels are generated about the main panels.
install packages from CRAN
install.packages(c("ggplot2","ggside"))
library(ggplot2)
library(ggside)
#> Registered S3 method overwritten by 'ggside':
#>   method from
#>   +.gg   ggplot2
df <- expand.grid(UpperCase = LETTERS, LowerCase = letters)
df$Combo_Index <- as.integer(df$UpperCase)*as.integer(df$LowerCase)

ggplot(df, aes(UpperCase, LowerCase)) +
  geom_tile(aes(fill = Combo_Index)) +
  geom_xsideboxplot(aes(y = Combo_Index)) +
  scale_xsidey_continuous()

ggplot(mpg, aes(displ, hwy, colour = class)) +
  geom_point(size = 2) +
  geom_xsideboxplot(aes(y =class), orientation = "y") +
  scale_xsidey_discrete() +
  geom_ysidedensity(aes(x = after_stat(density)), position = "stack") +
  scale_ysidex_continuous(guide = guide_axis(angle = 90), minor_breaks = NULL) +
  theme(ggside.panel.scale = .3)

However, when switching to the dev versions of ggplot2 and ggside
 devtools::install_github("tidyverse/ggplot2")
 devtools::install_github("jtlandis/ggside", ref = "dev")

The minor update in which you return NULL in the $map method yields the following result.
devtools::install_github("jtlandis/ggplot2")
devtools::install_github("jtlandis/ggside", ref = "dev")
library(ggplot2)
library(ggside)
#> Registered S3 method overwritten by 'ggside':
#>   method from
#>   +.gg   ggplot2
df <- expand.grid(UpperCase = LETTERS, LowerCase = letters)
df$Combo_Index <- as.integer(df$UpperCase)*as.integer(df$LowerCase)
ggplot(df, aes(UpperCase, LowerCase)) +
  geom_tile(aes(fill = Combo_Index)) +
  geom_xsideboxplot(aes(y = Combo_Index)) +
  scale_xsidey_continuous()

ggplot(mpg, aes(displ, hwy, colour = class)) +
  geom_point(size = 2) +
  geom_xsideboxplot(aes(y =class), orientation = "y") +
  scale_xsidey_discrete() +
  geom_ysidedensity(aes(x = after_stat(density)), position = "stack") +
  scale_ysidex_continuous(guide = guide_axis(angle = 90), minor_breaks = NULL) +
  theme(ggside.panel.scale = .3)

Please note, I have attempted to export vec_ptype2 methods for <logical> and <ggplot2_mapped_discrete> classes. While this does get past the scale_apply() function, it causes problems down the road. Specifically in the heat map plot, I receive an error when the boxplots stats are computed due to stat::quantile
ggplot(df, aes(UpperCase, LowerCase)) +
  geom_tile(aes(fill = Combo_Index)) +
  geom_xsideboxplot(aes(y = Combo_Index)) +
  scale_xsidey_continuous()
#> Warning: Computation failed in `stat_boxplot()`
#> Caused by error in `stats::quantile()`:
#> ! `quantile.ggplot2_mapped_discrete()` not implemented.

The error being raised with stat::quantile on a ggplot_mapped_discrete object is weird because it seems as though it should at least dispatch to the default method. But that may be an issue for another day.
Created on 2022-08-28 with reprex v2.0.2
Thank you for this detailed digest of some of the implications of our switch to vctrs. We did anticipate that this would cause breakage in the extension packages and once we begin extensive reverse dependency testing we will get a good overview of the impact and perhaps also a better grip on how to address it in the least disruptive way. Your suggestion may very well be the correct way forward but I'll avoid taking a stance before I have the full picture.
@jtlandis From a brief check, I couldn't find any issue with current CRAN ggplot2/ggside. Does this feature request still apply?
@teunbrand Did ggplot2 officially adopt vctrs or did it push it for a later version? I believe the main reason was the addition of the ggplot_mapped_descrete class.
If ggside and ggplot2 are compatible with the current CRAN versions then I am okay. Originally this was open due to the dev branch of ggplot2 being incompatible - but I do not expect that to halt ggplot2's development.
Feel free to close this issue if it suits the team.
ggplot2 has indeed adopted vctrs, but I think Thomas put in some effort to minimise the impact on extension packages. If you too are reasonably confident the original issue doesn't exist anymore, I think we could close this issue.
Alright, I'll close this for now. If this issue pops up again, feel free to post a new one.