ggplot2
 ggplot2 copied to clipboard
Legend for `geom_col()`'s size does not correctly depict change in size
I'm not sure if this is related to issue #3729 at all, but here it is: when using the size aesthetic for a bar/col geometry, the corresponding legend does not match differences in sizes in the plot like e.g. a point geometry would. This is especially true if the colour aesthetic is also mapped to a variable from the dataset, as the outline completely disappears from the legend and therefore the audience might think that it's the darker area that depicts the size:
library(ggplot2)
# coloured outline (continuous)
exp_df <- data.frame(x = letters[1:4], y = 1:4)
ggplot(exp_df, aes(x, y, size = y, colour = y)) +
  geom_col()

# coloured outline (discrete)
ggplot(exp_df, aes(x, y, size = y, colour = x)) +
  geom_col()

# transparent fill
ggplot(exp_df, aes(x, y, size = y, colour = y)) +
  geom_col(alpha = 0)

# single colour
ggplot(exp_df, aes(x, y, size = y)) +
  geom_col(colour = "red", alpha = 0)

Created on 2022-05-18 by the reprex package (v2.0.1)
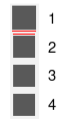
There is a very slight different in size (2 pixels) between the first square and the three others in the legend, but that's it:
Thanks, confirmed. I'm not sure if this is a bug or a spec at the moment, but looks strange...
library(ggplot2)

exp_df <- data.frame(x = letters[1:3], size = c(1, 4, 16))
ggplot(exp_df, aes(x, 1L, size = size)) +
  geom_col(colour = "red", fill = "transparent") +
  theme(
    legend.key.size = unit(0.2, "npc"),
    legend.position = "top"
  ) +
  scale_size_identity(guide = "legend")

Created on 2022-05-21 by the reprex package (v2.0.1)
I now think this is a reasonable behavior.
In draw_key_polygon(), the line width has a upper limit, and when the size in data is larger than that, the limit size is used.
https://github.com/tidyverse/ggplot2/blob/411f17b3ffebd4e5787468cd9b3079c4942de6be/R/legend-draw.r#L68-L73
The limit size is determined by the width and height of the key.
https://github.com/tidyverse/ggplot2/blob/411f17b3ffebd4e5787468cd9b3079c4942de6be/R/guide-legend.r#L637-L647
Apparently, the legends are usually smaller than the actual drawings in the plots, so I think limiting the line size is reasonable, otherwise the legend might overflow. But, if I understand correctly, ggplot2 doesn't provide any option to change that limit. We might expose some parameter for this, but I have no idea.
The draw_key_rect() method is currently only used in geom_raster() (as far as I can tell). It might be easy to repurpose draw_key_rect() to allow large lines, as geom_raster() doesn't use a size aesthetic, meaning there is unlikely a visual change in the key for that geom.
Thanks, but I think we should fix draw_key_polygon() if this behavior is a problem because probably this behavior is not limited to rectangles, and I expect we'll probably need to think how to handle the limits of the lines even if we move to draw_key_rect().
Also wondering: on my plot examples' canvas, any idea why the size step between 1 and 2 seems different to the other steps (2 to 3 and 3 to 4), i.e. a bigger jump in size? It doesn't seem to be a linear change and looks odd to me.
Because, by default, scale_size() scales area before ggplot2 v3.4.0.
https://ggplot2.tidyverse.org/reference/scale_size.html
To clarify, scale_size() will continue to scale area, but stroke with will move to the linewidth aesthetic and be scaled linearly