geom_node_col: Bar plot at each node
The geom_node_tile() draws nodes as tiles with center provided by the layout's x and y components and with width and height from the geom_node_tile()'s mapping. That's very useful.
I have a slightly different use-case: I wish to be able to draw something like a geom_col() at each node. I.e. two (or more) bars and not just a tile. The problem with geom_node_tile() is that as with geom_tile(), the x and y give the center, so comparing two bars/tiles is difficult as positioning from the center is fundamentally wrong.
I am wondering what you think would be the best way solving this? I have a few suggestions myself:
- Try to solve it in generality by making it possible for nodes to each have a
geom_col(). - Implement
geom_node_rect()usinggeom_rect()with it'sxmin,xmax,yminandymaxparameters. I am not sure if sensible default values can be provided. - Make extra arguments to
geom_node_tile():hjustandvjust: The defaulthjust = 0.5andvjust = 0.5gives functionality as now. In my case I would do something likehjust = 0andhjust = 0.5. Here, the problem is that the bars will use the same y coordinate.
Do you have any input on this?
I would prefer solving it in generality by a geom_node_col() as suggested in 1), but I'm not sure if that's possible.
In https://twitter.com/mikldk/status/1139420728254554114, @thomasp85 mentioned that solving this in general (item 1) would be good, but also that he hadn't had time to look at it, yet. Meanwhile @thomasp85 suggested to maybe use https://CRAN.R-project.org/package=scatterpie / https://github.com/GuangchuangYu/scatterpie.
Technically you can do this yourself using ggplot2::annotation_custom().
library(dplyr)
library(purrr)
library(ggplot2)
library(tidygraph)
library(ggraph)
set.seed(42)
g = tbl_graph(
nodes = tibble(x = sample(seq(1, 100, by = 5), 6), y = sample(seq(1, 100, by = 5), 6)),
edges = tibble(from = sample(1:3, 3),to = sample(4:6, 3))
)
p = as_tibble(g, "nodes") %>%
mutate(
plot = map(1:6,
~ ggplot(tibble(x = rnorm(100, sd = .x)), aes(x = x)) +
geom_histogram() + theme_bw(base_size = 8)),
annotation = pmap(list(x, y, plot),
~ annotation_custom(ggplotGrob(..3),
xmin = ..1 - 5, xmax = ..1 + 5,
ymin = ..2 - 5, ymax = ..2 + 5))
)
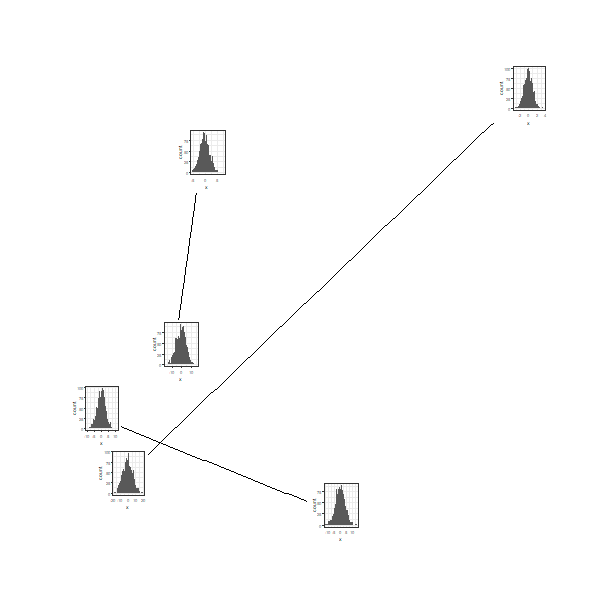
ggraph(g, layout = "manual", x = x, y = y) +
theme_graph() +
geom_edge_link() +
geom_node_tile(width = 10, height = 10) +
pull(p, annotation)
Also see https://github.com/thomasp85/ggforce/issues/147
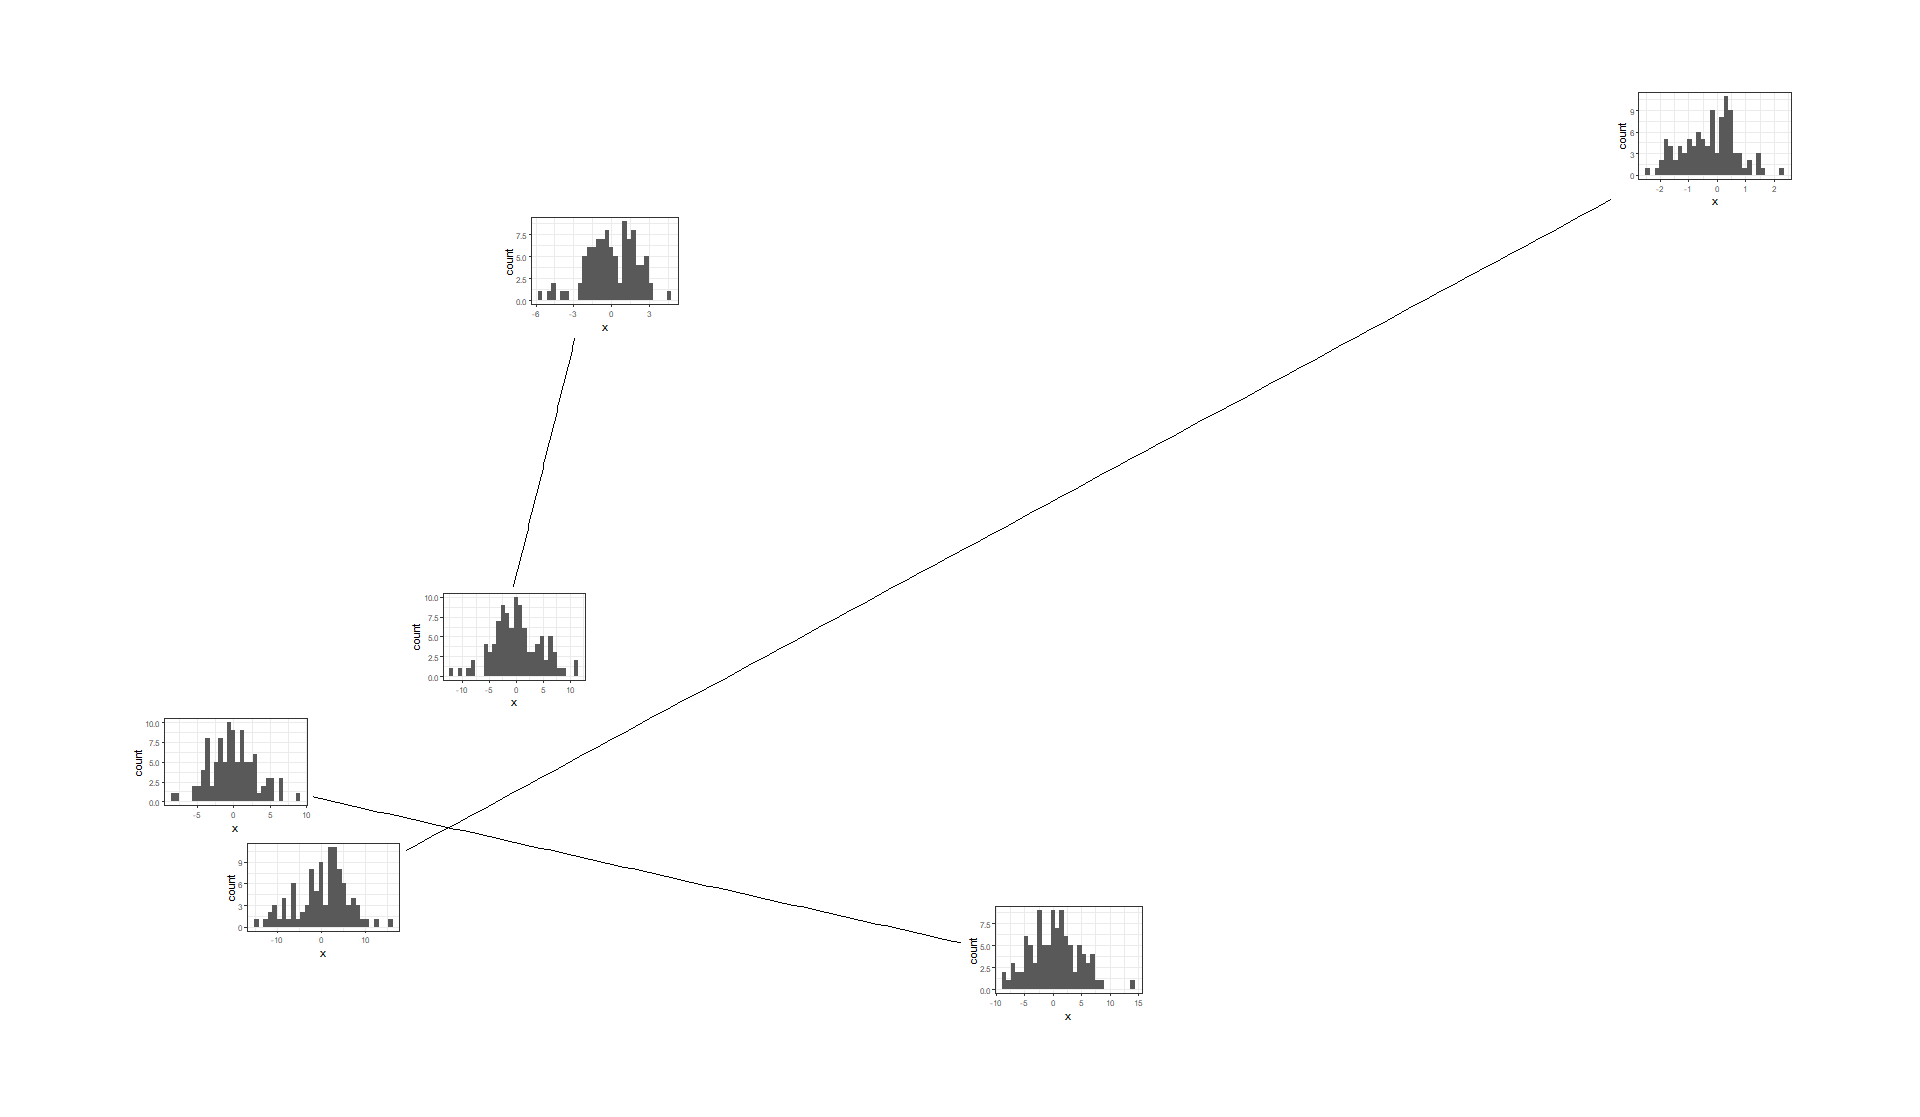
using ggsubplot2:
# remotes::install("mkoohafkan/ggsubplot2")
library(dplyr)
library(purrr)
library(ggplot2)
library(tidygraph)
library(ggraph)
library(ggsubplot2)

set.seed(42)

g = tbl_graph(
  nodes = tibble(x = sample(seq(1, 100, by = 5), 6), y = sample(seq(1, 100, by = 5), 6)),
  edges = tibble(from = sample(1:3, 3),to = sample(4:6, 3))
) %N>%
  mutate(plot = map(1:n(),
    ~ ggplot(tibble(x = rnorm(1000, sd = .x)),
          aes(x = x)) +
          geom_histogram() +
          theme_bw(base_size = 4)
  ))


ggraph(g, layout = "manual", x = x, y = y) +
  theme_graph() +
  geom_edge_link() +
  geom_node_tile(width = 10, height = 10) +
  geom_subfig(aes(x = x, y = y, plot = plot), width = 10, height = 10)