WebSocket-Node
 WebSocket-Node copied to clipboard
Memory leak with ping
I'm using this package both for server and client.
Server can be simplified to:
const wsConnections = new Set();
const wsServer = new server({
	httpServer,
	fragmentOutgoingMessages: false,
});
wsServer
	.on('request', (request) => {
		request.accept();
	})
	.on('connect', (connection) => {
		wsConnections.add(connection);
	})
	.on('close', (connection) => {
		wsConnections.delete(connection);
	});

function sendData (action, payload) {
    wsConnections.forEach(connection => {
        if (!connection.connected) {
            return;
        }
        connection.sendUTF(JSON.stringify({action, payload}));
    });
}
And sendData is called a few times per second with ~500 bytes payload.
On the client (also Node.js) I have something similar to this:
const wsClient = new websocket.client({
	maxReceivedFrameSize: 100 * 1024 * 1024,
	maxReceivedMessageSize: 100 * 1024 * 1024
});
wsClient
	.on('connect', function (connection) {
		const pingInterval = setInterval(() => {
			connection.ping();
		}, 0);
		connection
			.on('message', function (message) {
				if (message.type !== 'utf8') {
					return;
				}
				const {action, payload} = JSON.parse(message.utf8Data);

				...
			.on('close', function (reasonCode, description) {
				clearInterval(pingInterval);
			});
	})
	.connect('ws://' + host + ':' + port);
I've intentionally added 0 in setInterval so that it fails faster.
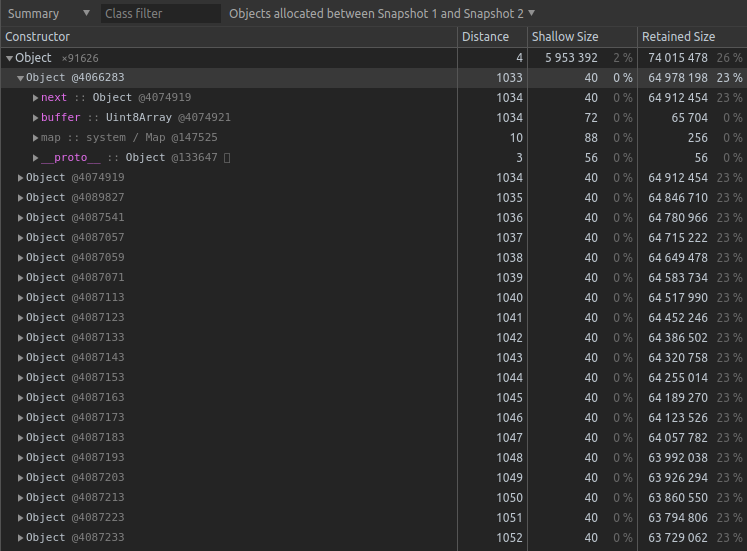
The issue here is that server will consume more and more memory over time.
Objects look like this:
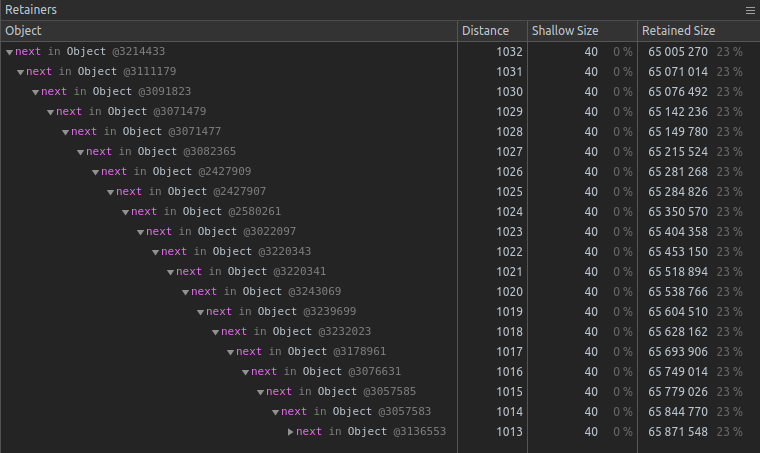
And retainers unsurprisingly like this:
If I stop pinging and disconnect client altogether server works fine and memory doesn't grow anymore, but it doesn't release already consumed memory either.
I'm using websocket 1.0.26 (latest as of right now) on Node.js 10.7.0 on Linux (Ubuntu 18.04). The same also happens on different machine with Node.js v6.
General observation initially and Chromium Dev Tools after that (on screenshots).
We also suspect there's a leak somewhere and we're trying to isolate (using node with remote inspector/chrome tools) but in our case it's with very large numbers of effectively idle connections (32-35k connections per server, using WSS/binary). Our build using 1.0.26 on node 10.8.0/ubuntu 16.04. Will post once we dig further. We do see node.js garbage collector clean out most of the memory on disconnection, but see idle connected memory usage increase over time.