thanos
 thanos copied to clipboard
store: use k-way merging for proxying logic
Use k-way merging for merging multiple responses coming from multiple StoreAPIs. This avoids having a bottleneck of a Go channel that can only hold 10 responses at once. So, now we will Recv() messages as fast as possible. Users should be able to see much quicker queries because network will be used as much as possible.
Benchmarks:
name                                                                                     old time/op    new time/op    delta
ProxySeries/1000000SeriesWith1Samples/4_client_with_1_samples,_250000_series_each-16        1.01s ± 7%     0.24s ± 2%  -76.62%  (p=0.008 n=5+5)
ProxySeries/1000000SeriesWith1Samples/single_client_with_1_samples,_1000000_series-16       926ms ± 3%     454ms ± 2%  -50.99%  (p=0.008 n=5+5)
ProxySeries/100000SeriesWith100Samples/4_client_with_25_samples,_25000_series_each-16      95.6ms ± 1%    23.4ms ± 3%  -75.52%  (p=0.016 n=4+5)
ProxySeries/100000SeriesWith100Samples/single_client_with_100_samples,_100000_series-16    93.1ms ± 2%    45.1ms ± 1%  -51.63%  (p=0.008 n=5+5)
ProxySeries/1SeriesWith10000000Samples/4_client_with_2500000_samples,_1_series_each-16     39.5µs ± 1%    25.2µs ± 1%  -36.22%  (p=0.008 n=5+5)
ProxySeries/1SeriesWith10000000Samples/single_client_with_10000000_samples,_1_series-16    22.6µs ± 0%    15.2µs ± 0%  -32.71%  (p=0.008 n=5+5)

name                                                                                     old alloc/op   new alloc/op   delta
ProxySeries/1000000SeriesWith1Samples/4_client_with_1_samples,_250000_series_each-16        186MB ± 0%     108MB ± 0%  -41.87%  (p=0.008 n=5+5)
ProxySeries/1000000SeriesWith1Samples/single_client_with_1_samples,_1000000_series-16       186MB ± 0%     107MB ± 0%  -42.18%  (p=0.008 n=5+5)
ProxySeries/100000SeriesWith100Samples/4_client_with_25_samples,_25000_series_each-16      18.5MB ± 0%    10.0MB ± 0%  -45.79%  (p=0.008 n=5+5)
ProxySeries/100000SeriesWith100Samples/single_client_with_100_samples,_100000_series-16    18.5MB ± 0%    10.6MB ± 0%  -42.69%  (p=0.008 n=5+5)
ProxySeries/1SeriesWith10000000Samples/4_client_with_2500000_samples,_1_series_each-16     10.9kB ± 0%     6.1kB ± 0%  -44.06%  (p=0.008 n=5+5)
ProxySeries/1SeriesWith10000000Samples/single_client_with_10000000_samples,_1_series-16    5.09kB ± 0%    3.06kB ± 0%  -39.83%  (p=0.008 n=5+5)

name                                                                                     old allocs/op  new allocs/op  delta
ProxySeries/1000000SeriesWith1Samples/4_client_with_1_samples,_250000_series_each-16        5.00M ± 0%     1.00M ± 0%  -80.00%  (p=0.008 n=5+5)
ProxySeries/1000000SeriesWith1Samples/single_client_with_1_samples,_1000000_series-16       5.00M ± 0%     1.00M ± 0%  -80.00%  (p=0.008 n=5+5)
ProxySeries/100000SeriesWith100Samples/4_client_with_25_samples,_25000_series_each-16        500k ± 0%      100k ± 0%  -79.96%  (p=0.008 n=5+5)
ProxySeries/100000SeriesWith100Samples/single_client_with_100_samples,_100000_series-16      500k ± 0%      100k ± 0%  -79.98%  (p=0.016 n=5+4)
ProxySeries/1SeriesWith10000000Samples/4_client_with_2500000_samples,_1_series_each-16        180 ± 0%       125 ± 0%  -30.56%  (p=0.008 n=5+5)
ProxySeries/1SeriesWith10000000Samples/single_client_with_10000000_samples,_1_series-16       109 ± 0%        80 ± 0%  -26.61%  (p=0.008 n=5+5)
TestProxyStore_SeriesSlowStores also passes which tests how everything works with slow stores.
Rewritten chunk deduplication logic to use hashing.
In the future, we could get some more marginal gains by using a selection/tournament tree.
Signed-off-by: Giedrius Statkevičius [email protected]
This is pretty sweet 💪🏽 Sounds like this might fix https://github.com/thanos-io/thanos/issues/4780 - will take a look this week or next (:
Tried this pull request in prod with a query that returns ~21k series - it reduced the query duration by about 30% :exploding_head:
I tested this in our infra and can confirm improved performance for queries across lots of series. Some queries went down from 40s to 30s. Dashboards also seem to be loading more smoothly.
Looking forward to seeing this merged 🚀
Please don't merge this yet - even though the code works and the benchmarks look even better (will post tomorrow) but I think there's some lock contention going. So, let me come back with some final tweaks and a bigger comment.
Mhm, it seems like it is impossible to implement this properly because gRPC RecvMsg() doesn't take any context variable, it uses the stream's context. Thus, to implement a per-request timeout, one needs to spawn a separate goroutine. This implies that one will need a channel in the middle to send responses back to the original goroutine or you'll need to synchronize these two things somehow differently. Because our goal is to RecvMsg() as fast as possible, it means that we must avoid having a channel in the middle. We could do a simple loop recv -> append in the main goroutine but if RecvMsg() blocks indefinitely then it would block everything going after it so two separate receiver/sender goroutines are necessary. https://github.com/grpc/grpc-go/issues/1229#issuecomment-302755717 this is a real pity that this is the accepted solution, to spawn a new goroutine for each RecvMsg() operation. I'll try to think about this more.
I have filed https://github.com/grpc/grpc-go/issues/5401 in the mean-time.
IMHO we should merge the lazy approach as the most potential gains in the eager one could come from https://github.com/grpc/grpc-go/issues/5401 i.e. not using a separate goroutine. However, that means we would lose per-RecvMsg() timeout so it's not feasible. What do you think about simply merging the completely lazy approach and then working on making Prometheus PromQL engine stream the samples?
Who knows when grpc/grpc-go#5401 could happen. I would agree on merging to take advantage now.
Updated the PR, I think it's ready to go:
- Added back the series statistics that I had removed accidentally;
- Added some unit tests for the deduplicating heap;
- Implemented the timeout for each Recv() call using
time.Timer
The only caveat of these changes is that in case of a timeout, the user will see "context canceled" instead of "failed to receive any data in $DURATION" because the timer cancels the context after the timeout.
Benchmarks:
name                                                                                     old time/op    new time/op    delta
ProxySeries/1000000SeriesWith1Samples/4_client_with_1_samples,_250000_series_each-16        990ms ± 5%     183ms ± 7%   -81.49%  (p=0.000 n=14+15)
ProxySeries/1000000SeriesWith1Samples/single_client_with_1_samples,_1000000_series-16       958ms ± 5%     255ms ± 2%   -73.39%  (p=0.000 n=15+13)
ProxySeries/100000SeriesWith100Samples/4_client_with_25_samples,_25000_series_each-16       101ms ± 5%      19ms ± 3%   -81.43%  (p=0.000 n=15+14)
ProxySeries/100000SeriesWith100Samples/single_client_with_100_samples,_100000_series-16    96.4ms ± 2%    25.6ms ± 1%   -73.41%  (p=0.000 n=12+13)
ProxySeries/1SeriesWith10000000Samples/4_client_with_2500000_samples,_1_series_each-16     39.8µs ± 3%    28.5µs ± 5%   -28.55%  (p=0.000 n=14+15)
ProxySeries/1SeriesWith10000000Samples/single_client_with_10000000_samples,_1_series-16    23.2µs ± 2%    17.2µs ± 4%   -25.99%  (p=0.000 n=15+15)

name                                                                                     old alloc/op   new alloc/op   delta
ProxySeries/1000000SeriesWith1Samples/4_client_with_1_samples,_250000_series_each-16        186MB ± 0%      84MB ± 0%   -54.79%  (p=0.000 n=15+15)
ProxySeries/1000000SeriesWith1Samples/single_client_with_1_samples,_1000000_series-16       186MB ± 0%      83MB ± 0%   -55.11%  (p=0.000 n=14+15)
ProxySeries/100000SeriesWith100Samples/4_client_with_25_samples,_25000_series_each-16      18.5MB ± 0%     7.6MB ± 0%   -58.75%  (p=0.000 n=15+14)
ProxySeries/100000SeriesWith100Samples/single_client_with_100_samples,_100000_series-16    18.5MB ± 0%     8.2MB ± 0%   -55.66%  (p=0.000 n=15+15)
ProxySeries/1SeriesWith10000000Samples/4_client_with_2500000_samples,_1_series_each-16     11.3kB ± 0%     8.3kB ± 0%   -26.39%  (p=0.000 n=11+15)
ProxySeries/1SeriesWith10000000Samples/single_client_with_10000000_samples,_1_series-16    5.20kB ± 0%    3.52kB ± 0%   -32.23%  (p=0.000 n=15+15)

name                                                                                     old allocs/op  new allocs/op  delta
ProxySeries/1000000SeriesWith1Samples/4_client_with_1_samples,_250000_series_each-16        5.00M ± 0%     0.00M ± 0%   -99.99%  (p=0.000 n=15+15)
ProxySeries/1000000SeriesWith1Samples/single_client_with_1_samples,_1000000_series-16       5.00M ± 0%     0.00M ± 0%  -100.00%  (p=0.000 n=13+15)
ProxySeries/100000SeriesWith100Samples/4_client_with_25_samples,_25000_series_each-16        500k ± 0%        0k ± 0%   -99.95%  (p=0.000 n=15+15)
ProxySeries/100000SeriesWith100Samples/single_client_with_100_samples,_100000_series-16      500k ± 0%        0k ± 0%   -99.97%  (p=0.000 n=15+14)
ProxySeries/1SeriesWith10000000Samples/4_client_with_2500000_samples,_1_series_each-16        185 ± 0%       144 ± 0%   -22.16%  (p=0.000 n=15+15)
ProxySeries/1SeriesWith10000000Samples/single_client_with_10000000_samples,_1_series-16       111 ± 0%        81 ± 0%   -27.03%  (p=0.000 n=15+15)
With k6 I have tested on a real-life Thanos with Query+Sidecar. A query that touches ~25M series:
http_req_duration..............: avg=9.53s min=8.93s med=9.19s max=11.3s p(90)=10.99s p(95)=11.15s
vs. vanilla Thanos
http_req_duration..............: avg=9.72s min=8.97s med=9.29s max=12.54s p(90)=10.64s p(95)=11.59s
So, the improvement is around 5%. Still not bad :smile:
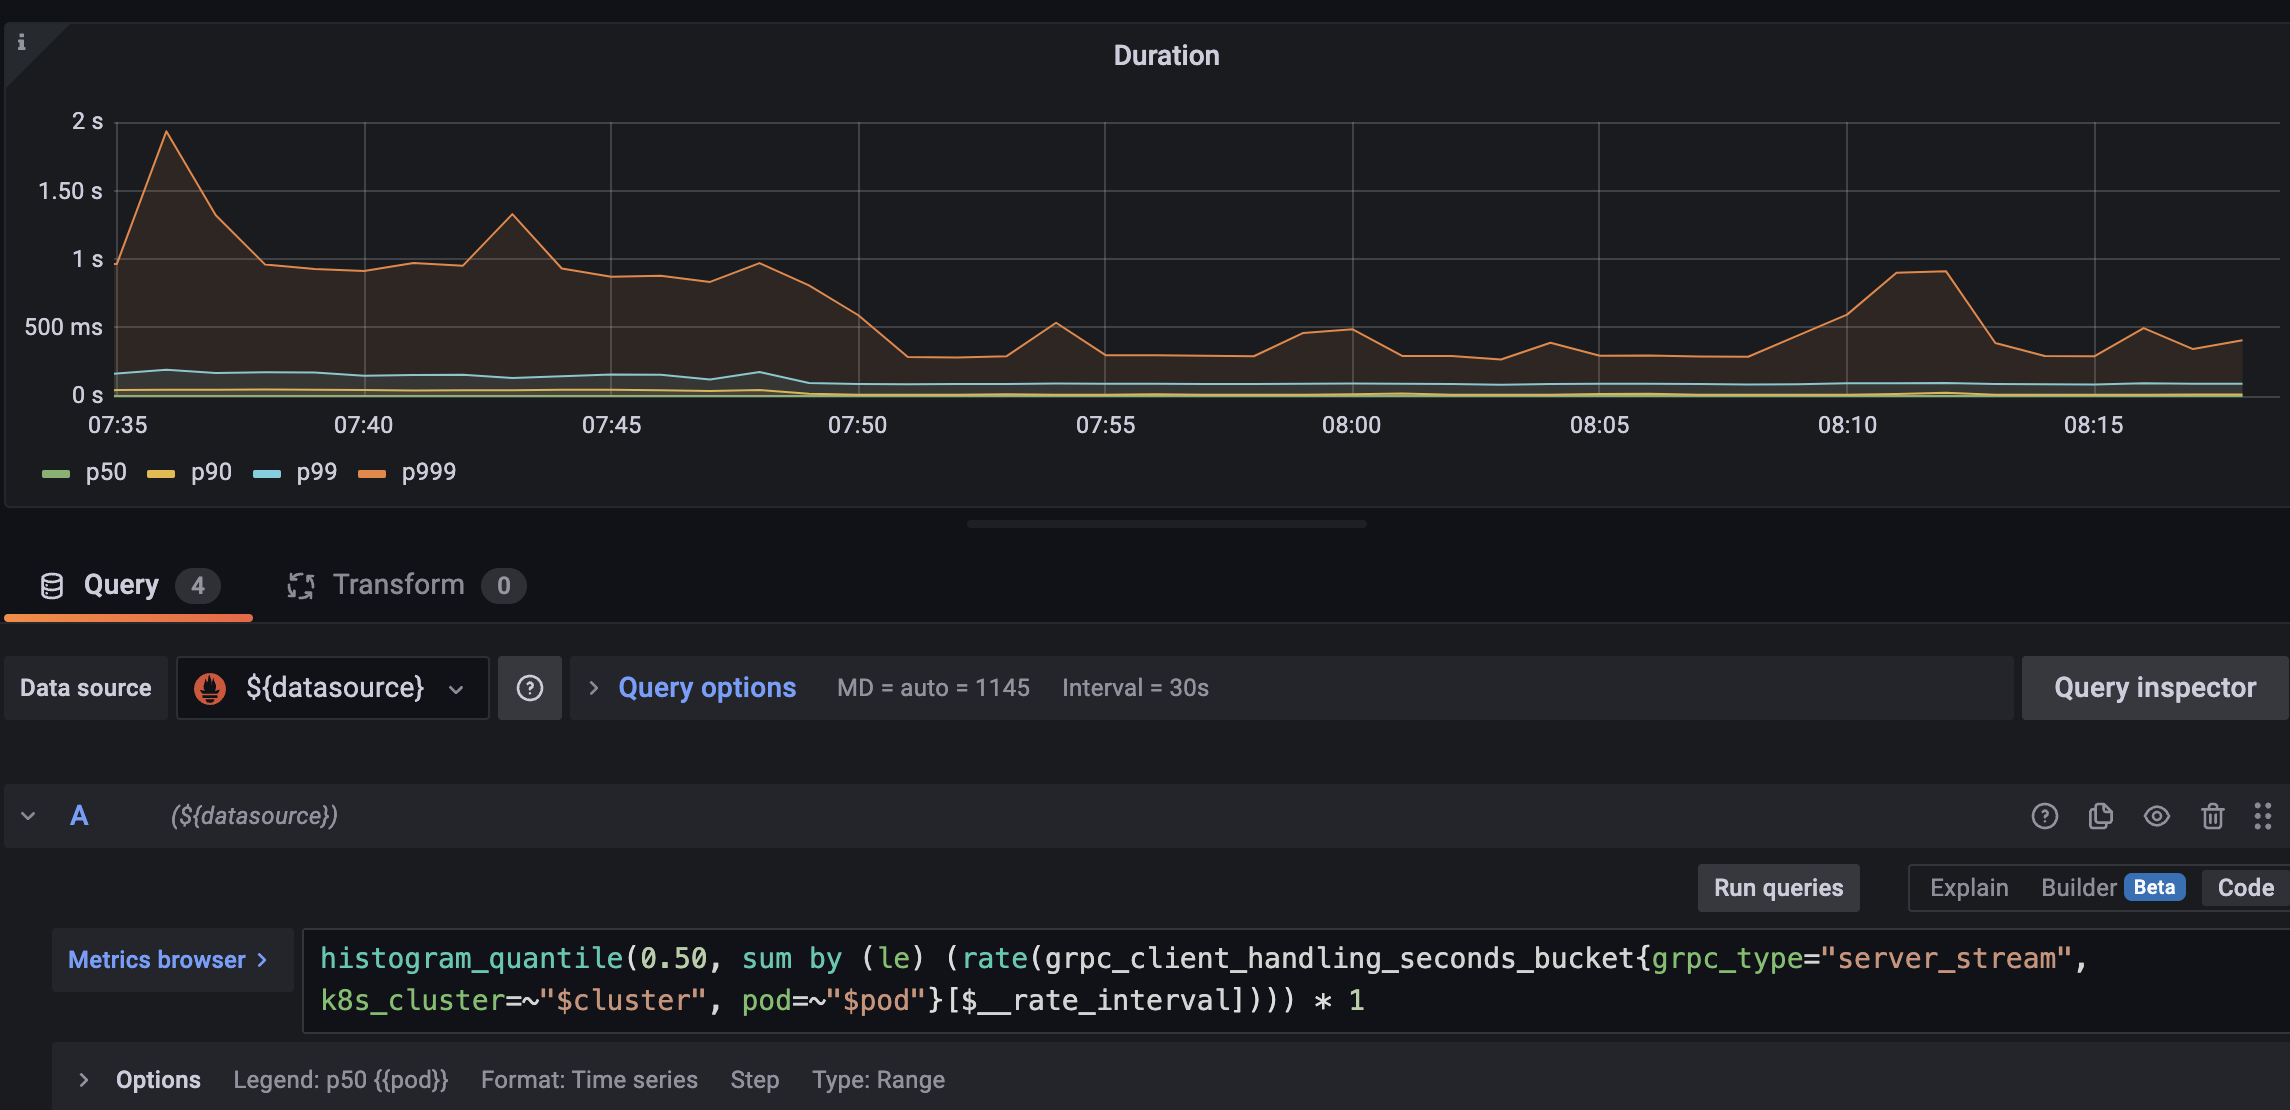
I deployed this in one of our environments, and I saw a drop in the p90 for gRPC stream duration.
However, I also noticed a drop in series selects per second.
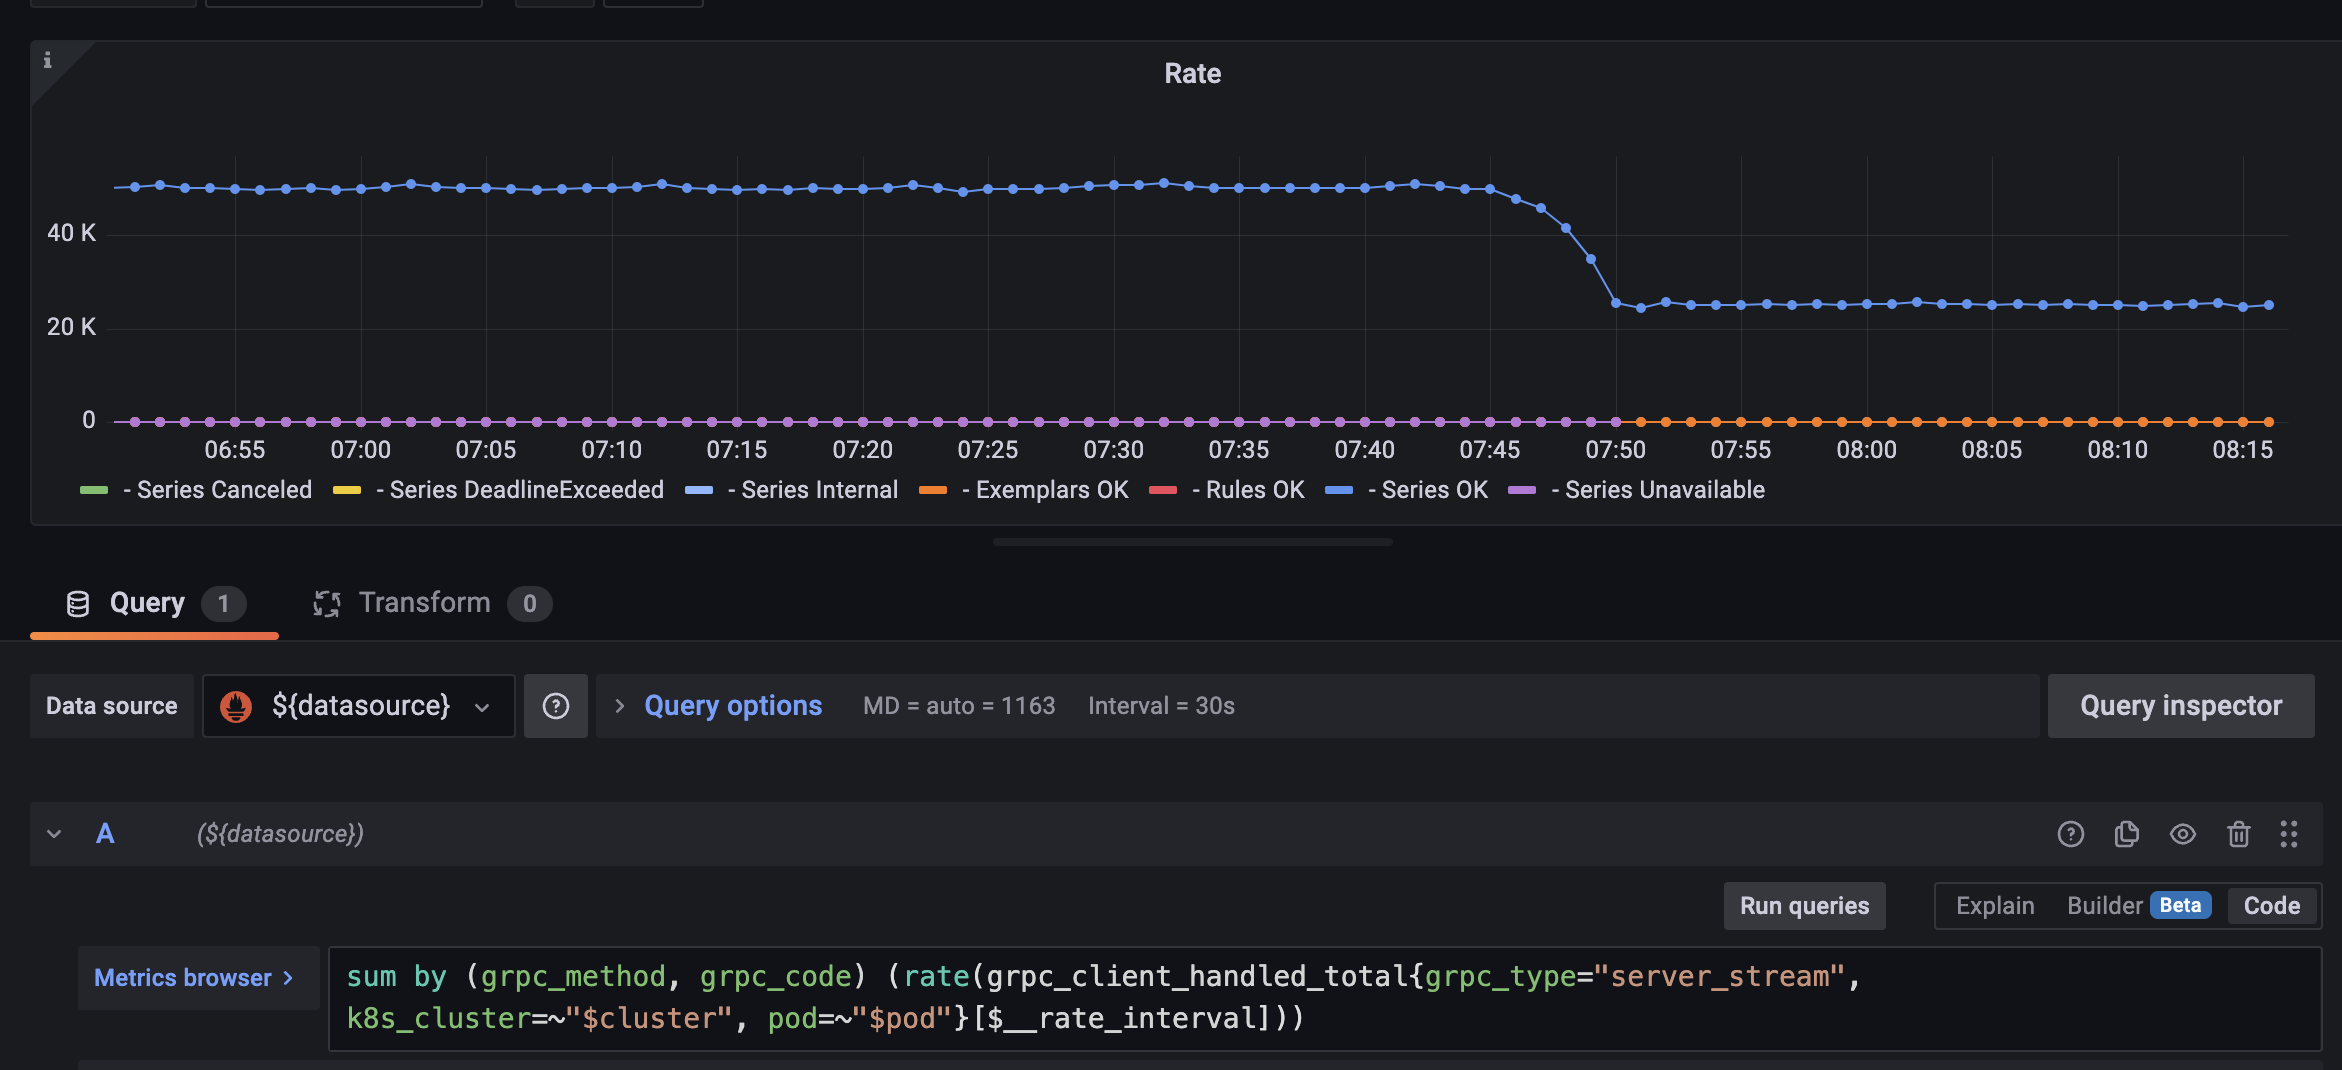
Would the latter be a concern, or an artefact of the new implementation?
@fpetkovski that's a big drop :scream: previously we were doing everything concurrently but with the eager version we wait for all of the results at first and then merge everything. Perhaps one of the Series() calls during proxying fails and thus the other ones don't happen? Is there anything in the logs? Also, I wonder if it would help to switch to lazy evaluation because that would be much closer to the previous behavior.
Yes, I can try this again next week, currently I am OOO.
The drop seems to be exactly 50%, so I was wondering if we were either doing something more efficiently :)
I tried the lazy approach and the grpc_client_handled_total metric was almost the same as in the eager approach. However, I did feel like the individual queries were faster with the lazy strategy.
I don't have an explanation for why the metric would drop in half, but I also don't see an actual issue. There was no increase in the error rate and the thanos_query_concurrent_selects_gate_duration_seconds_count metric, which measures how many series selects we are doing, stayed the same as on the main branch.
So I'm happy with seeing this merged whenever others feel it's good to go.
Sorry actually in the lazy implementation I do see an issue. In the logs I get see:
Internal desc = runtime error: invalid memory address or nil pointer dereference" msg="returning partial response"
This is when the querier is used as a store for another (root level) querier and the error happens in the querier above. I don't see this for the eager strategy.
Here is an illustration of that, the error rate in the root querier (which talks to the new optimized proxy with a lazy strategy) experienced an increase in series select errors when I did the rollout:
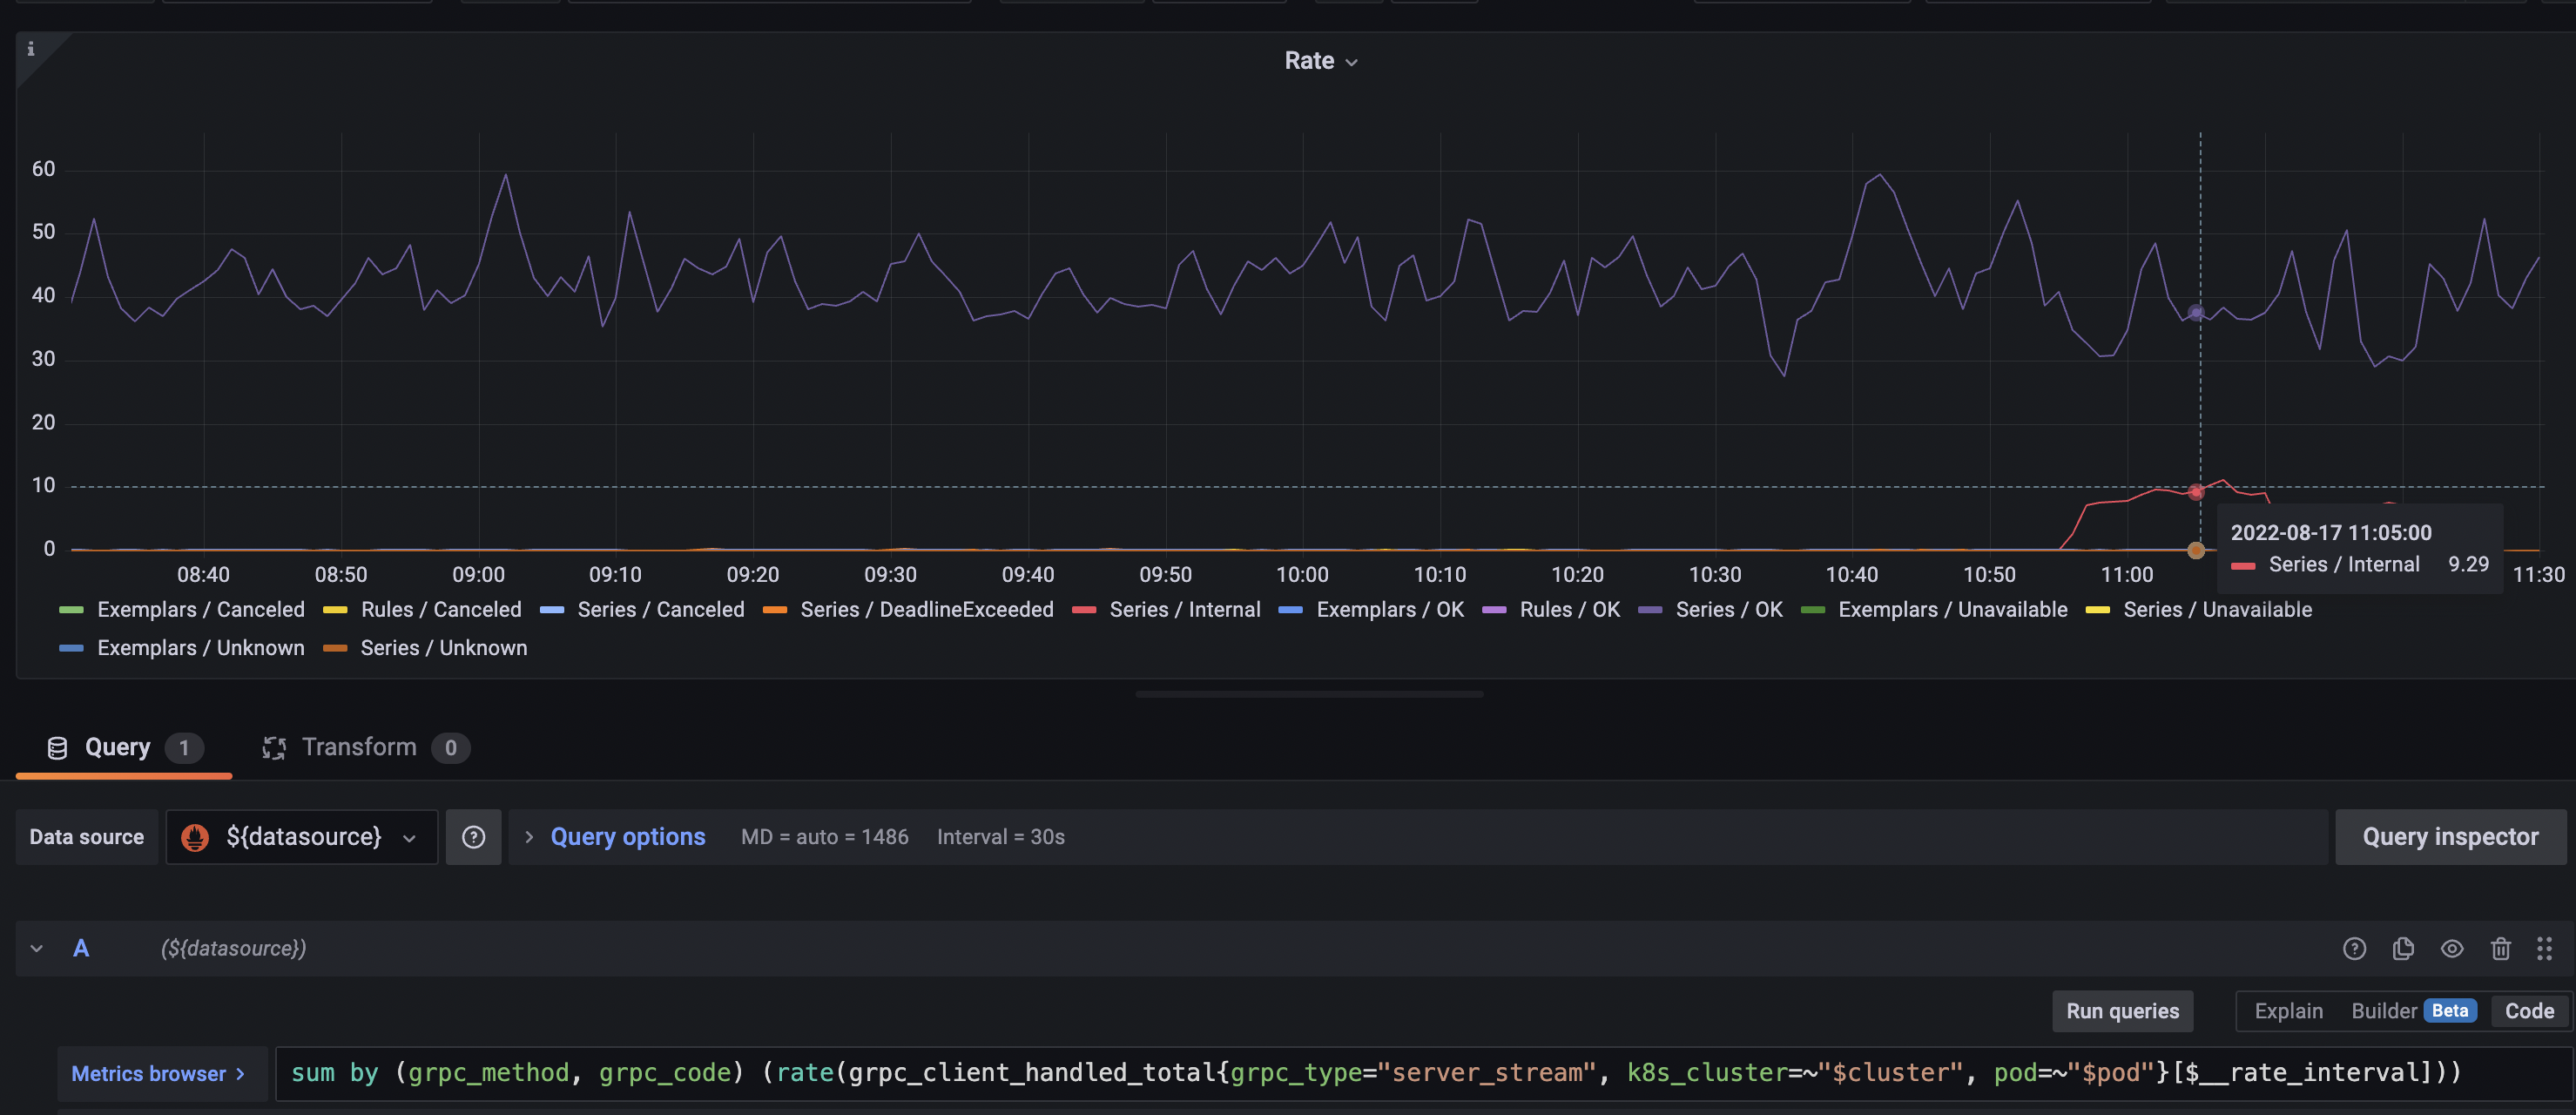
We don't check one error, so this might some intermediate issue we accidentally pass as success?
Updated PR:
- Fixed everything according to comments;
- Remove
Error()method to not mislead readers - we actually convert all errors into warnings now and then the Series() function itself decides whether those warnings are errors or not depending on what partial response strategy has been set; - Added a hidden parameter for setting the proxying strategy and used it in e2e tests to test how it works;
- Tried to repro @fpetkovski's case in e2e tests but cannot reproduce it;
- Brought back
could not receive data from X StoreAPI in Y seconds- we now check whether the timer has fired or not if the error iscontext.Canceled. If that's true then it means that the timer has fired and that the per-Recv() timeout has been reached.
Eager strategy benchmarks:
name                                                                                     old time/op    new time/op    delta
ProxySeries/1000000SeriesWith1Samples/4_client_with_1_samples,_250000_series_each-16        1.03s ± 5%     0.18s ± 5%   -82.34%  (p=0.000 n=10+10)
ProxySeries/1000000SeriesWith1Samples/single_client_with_1_samples,_1000000_series-16       955ms ± 4%     260ms ±14%   -72.76%  (p=0.000 n=10+10)
ProxySeries/100000SeriesWith100Samples/4_client_with_25_samples,_25000_series_each-16      96.2ms ± 3%    18.7ms ± 5%   -80.54%  (p=0.000 n=8+9)
ProxySeries/100000SeriesWith100Samples/single_client_with_100_samples,_100000_series-16     117ms ±22%      25ms ± 2%   -79.03%  (p=0.000 n=10+8)
ProxySeries/1SeriesWith10000000Samples/4_client_with_2500000_samples,_1_series_each-16     42.4µs ± 9%    30.8µs ± 8%   -27.42%  (p=0.000 n=10+10)
ProxySeries/1SeriesWith10000000Samples/single_client_with_10000000_samples,_1_series-16    23.6µs ± 4%    17.6µs ± 2%   -25.42%  (p=0.000 n=10+10)

name                                                                                     old alloc/op   new alloc/op   delta
ProxySeries/1000000SeriesWith1Samples/4_client_with_1_samples,_250000_series_each-16        186MB ± 0%      84MB ± 0%   -54.79%  (p=0.000 n=9+10)
ProxySeries/1000000SeriesWith1Samples/single_client_with_1_samples,_1000000_series-16       186MB ± 0%      83MB ± 0%   -55.11%  (p=0.000 n=9+10)
ProxySeries/100000SeriesWith100Samples/4_client_with_25_samples,_25000_series_each-16      18.5MB ± 0%     7.6MB ± 0%   -58.75%  (p=0.000 n=10+10)
ProxySeries/100000SeriesWith100Samples/single_client_with_100_samples,_100000_series-16    18.5MB ± 0%     8.2MB ± 0%   -55.66%  (p=0.000 n=9+10)
ProxySeries/1SeriesWith10000000Samples/4_client_with_2500000_samples,_1_series_each-16     11.3kB ± 0%     8.1kB ± 0%   -28.10%  (p=0.000 n=9+9)
ProxySeries/1SeriesWith10000000Samples/single_client_with_10000000_samples,_1_series-16    5.20kB ± 0%    3.47kB ± 0%   -33.15%  (p=0.000 n=10+10)

name                                                                                     old allocs/op  new allocs/op  delta
ProxySeries/1000000SeriesWith1Samples/4_client_with_1_samples,_250000_series_each-16        5.00M ± 0%     0.00M ± 1%   -99.99%  (p=0.000 n=9+10)
ProxySeries/1000000SeriesWith1Samples/single_client_with_1_samples,_1000000_series-16       5.00M ± 0%     0.00M ± 1%  -100.00%  (p=0.000 n=10+10)
ProxySeries/100000SeriesWith100Samples/4_client_with_25_samples,_25000_series_each-16        500k ± 0%        0k ± 0%   -99.95%  (p=0.000 n=10+8)
ProxySeries/100000SeriesWith100Samples/single_client_with_100_samples,_100000_series-16      500k ± 0%        0k ± 0%   -99.97%  (p=0.000 n=9+9)
ProxySeries/1SeriesWith10000000Samples/4_client_with_2500000_samples,_1_series_each-16        185 ± 0%       144 ± 0%   -22.16%  (p=0.000 n=10+10)
ProxySeries/1SeriesWith10000000Samples/single_client_with_10000000_samples,_1_series-16       111 ± 0%        81 ± 0%   -27.03%  (p=0.000 n=10+10)
Lazy strategy benchmarks:
name                                                                                     old time/op    new time/op    delta
ProxySeries/1000000SeriesWith1Samples/4_client_with_1_samples,_250000_series_each-16        1.03s ± 5%     0.19s ± 3%  -81.92%  (p=0.000 n=10+10)
ProxySeries/1000000SeriesWith1Samples/single_client_with_1_samples,_1000000_series-16       955ms ± 4%     274ms ± 2%  -71.29%  (p=0.000 n=10+10)
ProxySeries/100000SeriesWith100Samples/4_client_with_25_samples,_25000_series_each-16      96.2ms ± 3%    19.3ms ± 5%  -79.89%  (p=0.000 n=8+10)
ProxySeries/100000SeriesWith100Samples/single_client_with_100_samples,_100000_series-16     117ms ±22%      28ms ± 2%  -76.16%  (p=0.000 n=10+9)
ProxySeries/1SeriesWith10000000Samples/4_client_with_2500000_samples,_1_series_each-16     42.4µs ± 9%    30.4µs ± 1%  -28.33%  (p=0.000 n=10+9)
ProxySeries/1SeriesWith10000000Samples/single_client_with_10000000_samples,_1_series-16    23.6µs ± 4%    17.3µs ± 3%  -26.50%  (p=0.000 n=10+10)

name                                                                                     old alloc/op   new alloc/op   delta
ProxySeries/1000000SeriesWith1Samples/4_client_with_1_samples,_250000_series_each-16        186MB ± 0%      81MB ± 1%  -56.17%  (p=0.000 n=9+10)
ProxySeries/1000000SeriesWith1Samples/single_client_with_1_samples,_1000000_series-16       186MB ± 0%      77MB ± 5%  -58.43%  (p=0.000 n=9+10)
ProxySeries/100000SeriesWith100Samples/4_client_with_25_samples,_25000_series_each-16      18.5MB ± 0%     7.4MB ± 1%  -60.27%  (p=0.000 n=10+10)
ProxySeries/100000SeriesWith100Samples/single_client_with_100_samples,_100000_series-16    18.5MB ± 0%     6.9MB ± 4%  -62.51%  (p=0.000 n=9+10)
ProxySeries/1SeriesWith10000000Samples/4_client_with_2500000_samples,_1_series_each-16     11.3kB ± 0%     8.4kB ± 0%  -25.54%  (p=0.000 n=9+9)
ProxySeries/1SeriesWith10000000Samples/single_client_with_10000000_samples,_1_series-16    5.20kB ± 0%    3.55kB ± 0%  -31.77%  (p=0.000 n=10+10)

name                                                                                     old allocs/op  new allocs/op  delta
ProxySeries/1000000SeriesWith1Samples/4_client_with_1_samples,_250000_series_each-16        5.00M ± 0%     0.00M ±52%  -99.99%  (p=0.000 n=9+9)
ProxySeries/1000000SeriesWith1Samples/single_client_with_1_samples,_1000000_series-16       5.00M ± 0%    0.00M ±107%  -99.98%  (p=0.000 n=10+9)
ProxySeries/100000SeriesWith100Samples/4_client_with_25_samples,_25000_series_each-16        500k ± 0%        0k ±13%  -99.93%  (p=0.000 n=10+10)
ProxySeries/100000SeriesWith100Samples/single_client_with_100_samples,_100000_series-16      500k ± 0%        0k ±72%  -99.91%  (p=0.000 n=9+10)
ProxySeries/1SeriesWith10000000Samples/4_client_with_2500000_samples,_1_series_each-16        185 ± 0%       148 ± 0%  -20.00%  (p=0.000 n=10+10)
ProxySeries/1SeriesWith10000000Samples/single_client_with_10000000_samples,_1_series-16       111 ± 0%        82 ± 0%  -26.13%  (p=0.000 n=10+10)
Ha, the e2e test failure seems to be exactly what I saw :)
Yeah 👍 trying to fix it and then we can merge this
I think I have fixed all of the bugs. PTAL @bwplotka @fpetkovski @yeya24 :pray: