thanos
 thanos copied to clipboard
Query errors after vertical compaction (penalty): Error executing query: sum and count timestamps not aligned
Thanos, Prometheus and Golang version used:
thanos, version 0.22.0 (branch: non-git, revision: non-git) build user: root@b63a1c94421f build date: 20210727-14:31:15 go version: go1.16.2 platform: linux/amd64
Object Storage Provider:
S3 storage
What happened:
After enabling vertical compaction and it being finished we see errors for longer range queries in Thanos query:
Example queries can be as simple as sum(up) over 4w.
Error executing query: sum and count timestamps not aligned
What you expected to happen:
Queries to work as they did before vertical compaction.
How to reproduce it (as minimally and precisely as possible):
- Enable vertical compaction and let it finish:
--deduplication.func=penalty --deduplication.replica-label=prometheus_replica
- Query long time range with
sum(up)
Full logs to relevant components:
Anything else we need to know:
The issue triggers reliably with downsampled data. We keep 4w of raw data and older data only as 5m and 1h downsampled and whenever a downsampled block gets queried above error gets returned.
Looks like this error is due to how we re-build the downsampled chunks using the deduplication algorithm. I will assign this myself and investigate. Thanks for the issue!
Running --compact.concurrency=3 --deduplication.func=penalty --compact.enable-vertical-compaction --deduplication.replica-label=prometheus_node_id here with 0.22.0 and ran sum(up), it completed successfully. Cannot reproduce personally. If the block is small, perhaps you could upload it somewhere? Or maybe you could upload the original block? That would be even better.
I'll probably not be able to upload any blocks.
Is there any way I can find what you are looking for in the data without providing access to the blocks?
I'm having the same issue over here. This mainly happens if I query downsampled data with auto downsampling in the querier, which has been deduplicated before. I keep Raw data for the last 4 weeks. Before this timestamp, I only have 5m and 1h data. When I query earlier than this using auto downsampling, the error occurs.
What @margau is describing is pretty much exactly our setup. Will update the description.
Hello 👋 Looks like there was no activity on this issue for the last two months.
Do you mind updating us on the status? Is this still reproducible or needed? If yes, just comment on this PR or push a commit. Thanks! 🤗
If there will be no activity in the next two weeks, this issue will be closed (we can always reopen an issue if we need!). Alternatively, use remind command if you wish to be reminded at some point in future.
Sorry, I looked at it before but cannot reproduce the issue. Is it possible to provide your data block so that I can debug the issue? I will continue working on it.
@yeya24 we don't have any affected blocks at the moment and I can't upload the data as well, we could prepare a call though and look at it together if that helps at all.
up{pod=~"spring-boot-prometheus-playground-.*"}
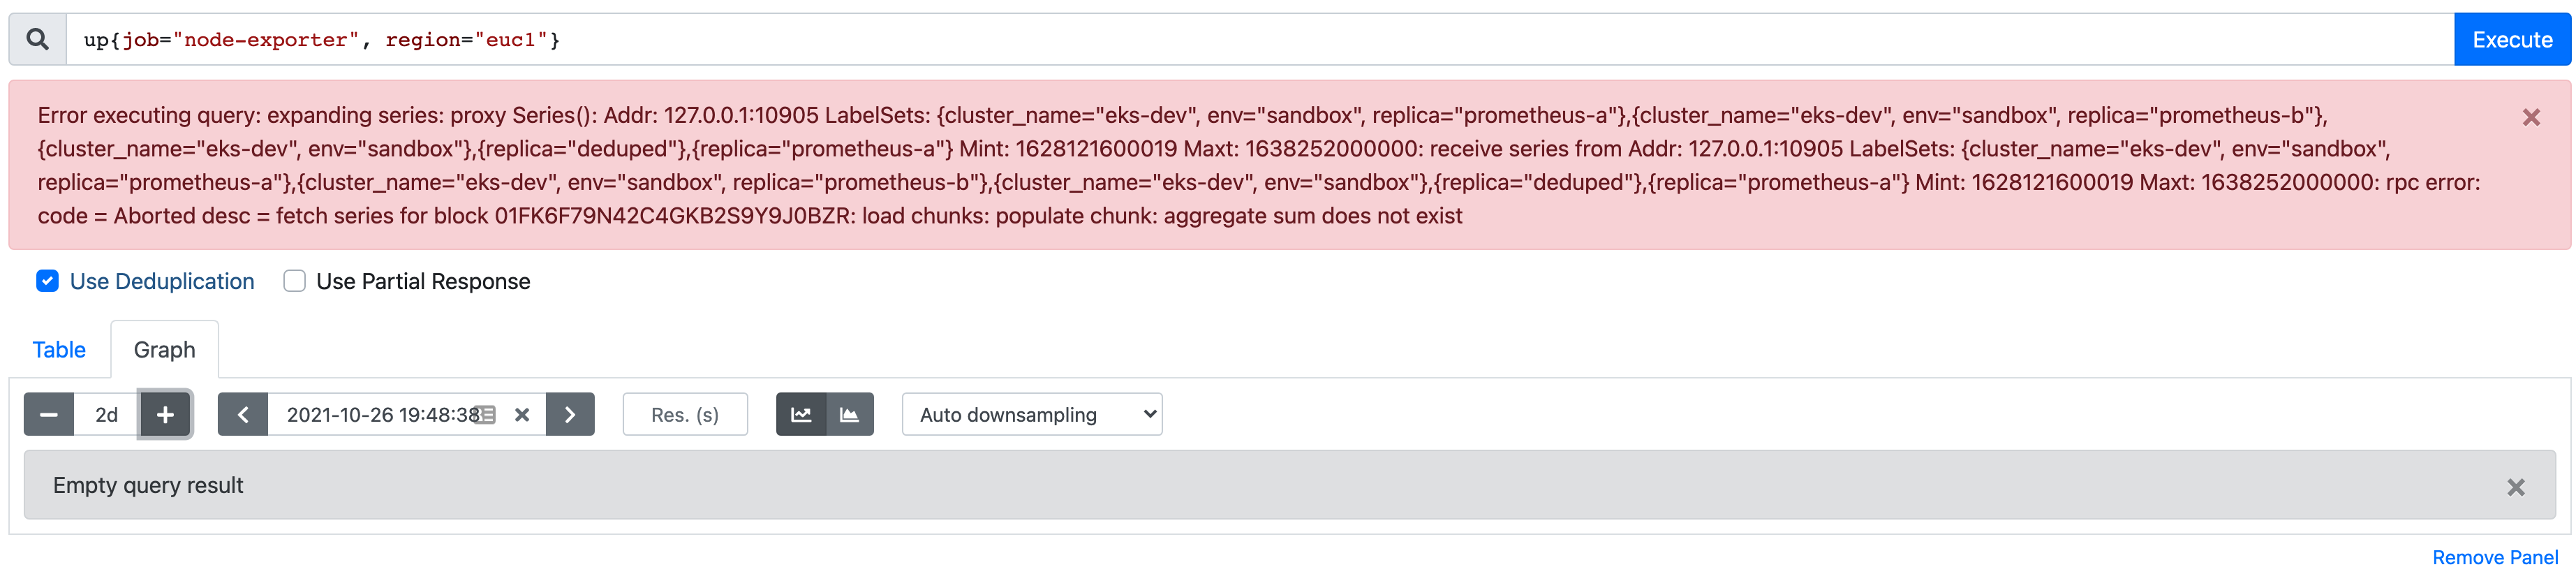
Similar to above - but another Prometheus/Thanos setup where the Vertical compaction is also running.
When using the Thanos Querier, it works fine up and including 2 days.
When I increase the range to 1w - I get:
Error executing query: sum and count timestamps not aligned
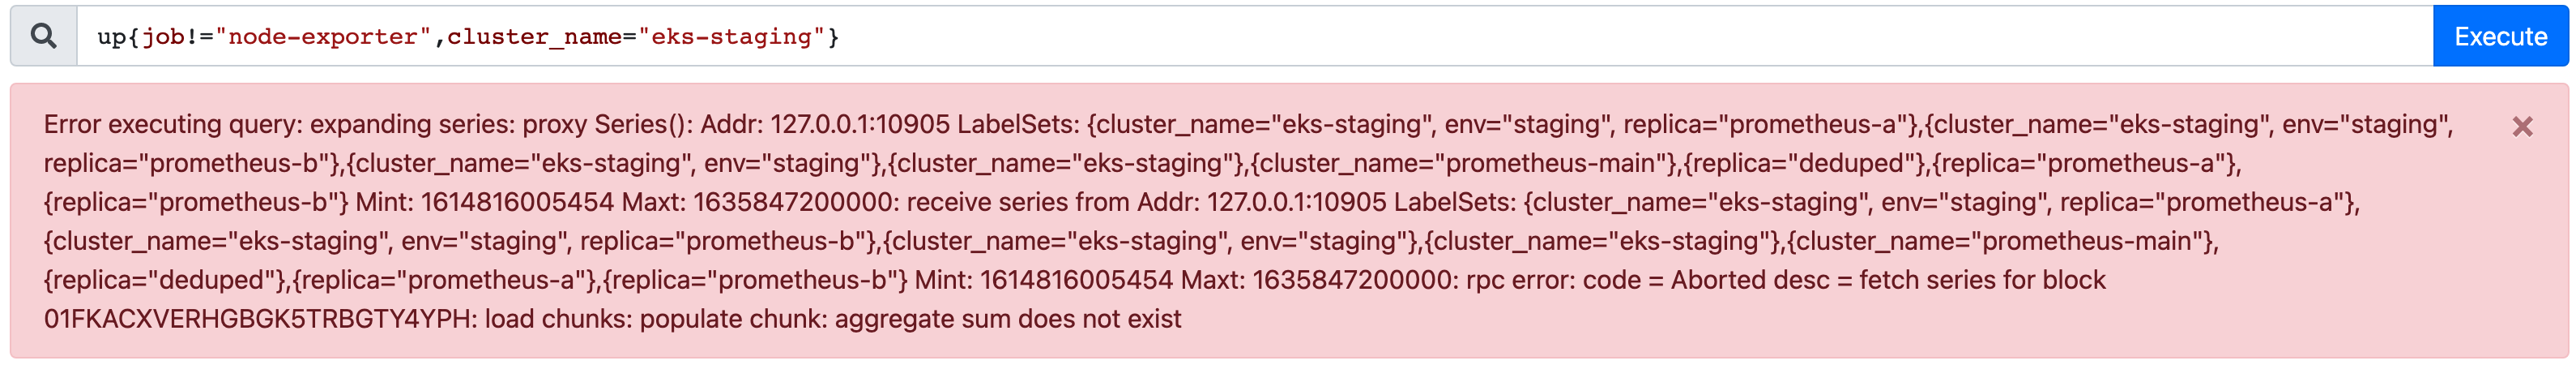
And 2w gives me:
Error executing query: expanding series: proxy Series(): Addr: 127.0.0.1:10905 LabelSets: {cluster_name="eks-dev", env="sandbox", replica="prometheus-a"},{cluster_name="eks-dev", env="sandbox", replica="prometheus-b"},{cluster_name="eks-dev", env="sandbox"},{replica="deduped"},{replica="prometheus-a"} Mint: 1628121600019 Maxt: 1635940800000: receive series from Addr: 127.0.0.1:10905 LabelSets: {cluster_name="eks-dev", env="sandbox", replica="prometheus-a"},{cluster_name="eks-dev", env="sandbox", replica="prometheus-b"},{cluster_name="eks-dev", env="sandbox"},{replica="deduped"},{replica="prometheus-a"} Mint: 1628121600019 Maxt: 1635940800000: rpc error: code = Aborted desc = fetch series for block 01FK6F79N42C4GKB2S9Y9J0BZR: load chunks: populate chunk: aggregate sum does not exist
@yeya24 Hi Ben, Is there anything I can do to support this to get resolved? I may be able to get you some data privately - or if there is anything I can try to do/run to give you more info.
Trying to add a test for this here https://github.com/thanos-io/thanos/issues/4549 but cannot reproduce it. Does this error still happen if you only query (using the selection UI) Thanos Store?
I do not have issues with every block - but I will hit some with issues when analysing a larger time-frame - and then the fun stops. Not sure if it's possible to re-build the blocks to get it sorted - or if they are simply overlapping in some way. I might be able to find a block with issues - and share that with you (somehow).
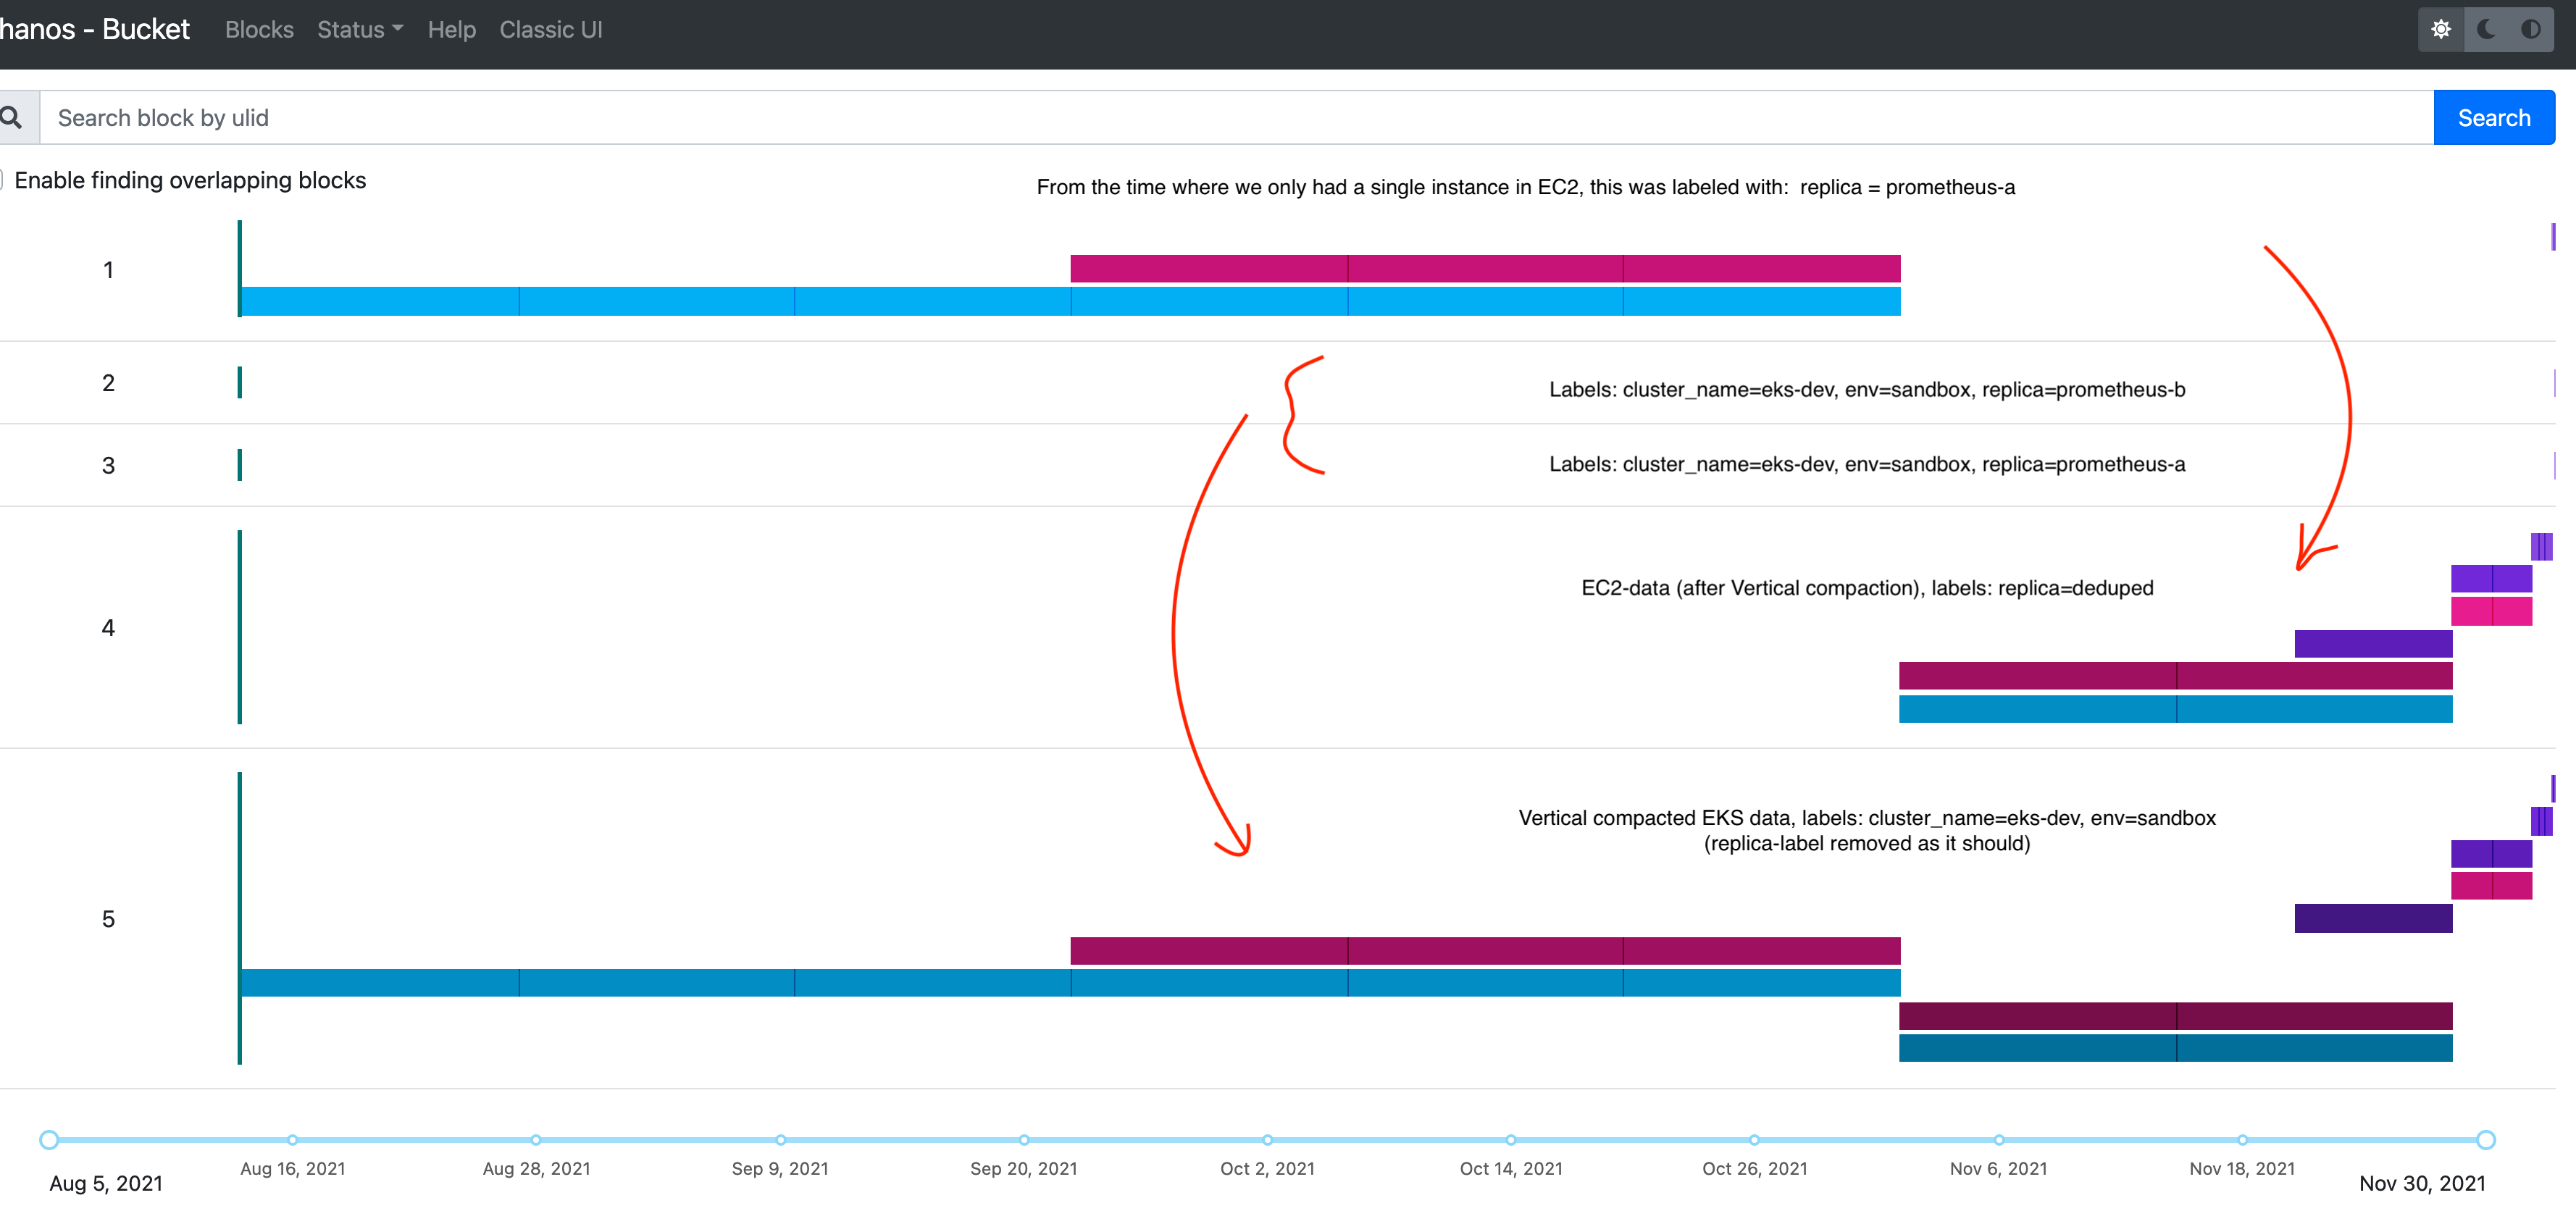
I downloaded a few of the "failing" chunks and tried to do some verifications of them. No issues were found. But with more investigations - I have another theory. Some more time has passed since we first encountered this - and it seems like it's related to the switch between Vertical compacted data - and data that is not. Also the compaction level is different on data before (when It's not working) - and after. Based on the query - it's querying for all possible labels. - and maybe this is where it's getting confused. I could not get it to compact (change the replica label on the old EC2 data) as we didn't have any prometheus-b there to start with. (Should still be able to see this data - and "merge it" down to replica=deduped. From the "main" servers in EC2 - we are doing some cross-environment/region scrapes - so this is why we didn't put more info on the global labels - but maybe we have to re-think that if that can be part of the problem. We also have other environments where the compaction (optimising, downsampling and vertical) has stopped - so we only have 2h blocks for the last month. With no errors in the logs. In Production we also had to stop the Vertical Compaction for some of the buckets - as it was never able to finish - also without any reasons or status in the logs - but I can see that more metrics and messages are coming in the next version.
 .
.
Seems like we need to add a test case for switching to vertical compaction from regular compaction. Help wanted.
Hello 👋 Looks like there was no activity on this issue for the last two months.
Do you mind updating us on the status? Is this still reproducible or needed? If yes, just comment on this PR or push a commit. Thanks! 🤗
If there will be no activity in the next two weeks, this issue will be closed (we can always reopen an issue if we need!). Alternatively, use remind command if you wish to be reminded at some point in future.
With default out of order ingestion on Prom's side this needs more attention than ever
Hello ! I have the same issue on my Prometheus/Thanos stack
Error executing query: expanding series: proxy Series(): Addr: <my store gateway server>:19092 LabelSets: {env="infra"} Mint: 1661126400000 Maxt: 1675814400000: receive series from Addr: <my store gateway server>:19092 LabelSets: {env="infra"} Mint: 1661126400000 Maxt: 1675814400000: rpc error: code = Unknown desc = receive series from 01GRDPK0F8BNSREH2QPA5RS3T9: preload series: read series range: get range reader: stat /mnt/thanos_tsdb/tsdb/01GRDPK0F8BNSREH2QPA5RS3T9/index: stat /mnt/thanos_tsdb/tsdb/01GRDPK0F8BNSREH2QPA5RS3T9/index: no such file or directory
Retention seems broken, cause I have no more data after 4 days in past (prometheus server store 4days) My thanos compactor config is :
thanos compact --data-dir=/mnt/thanos_tsdb/thanos-compacter --objstore.config-file=/opt/thanos/bucket_config.yaml --retention.resolution-raw=2d --retention.resolution-5m=20d --retention.resolution-1h=365d --wait --wait-interval=5m --http-address=0.0.0.0:10902 --compact.concurrency=24 --log.level=debug --log.format=logfmt --delete-delay=48h --deduplication.replica-label=replica
Problem appears when we have decided to use different prometheus server according servers to monitor. We have prometheus servers for our production servers that use thanos to store data (with thanos sidecar) and we have other prometheus server to monitor our dev server that don't store data in thanos, only on prometheus for few days. So we have changed the value of label "env". Old value was : infra New value is : dc1_prod for production prometheus and dc1_dev for dev promtheus
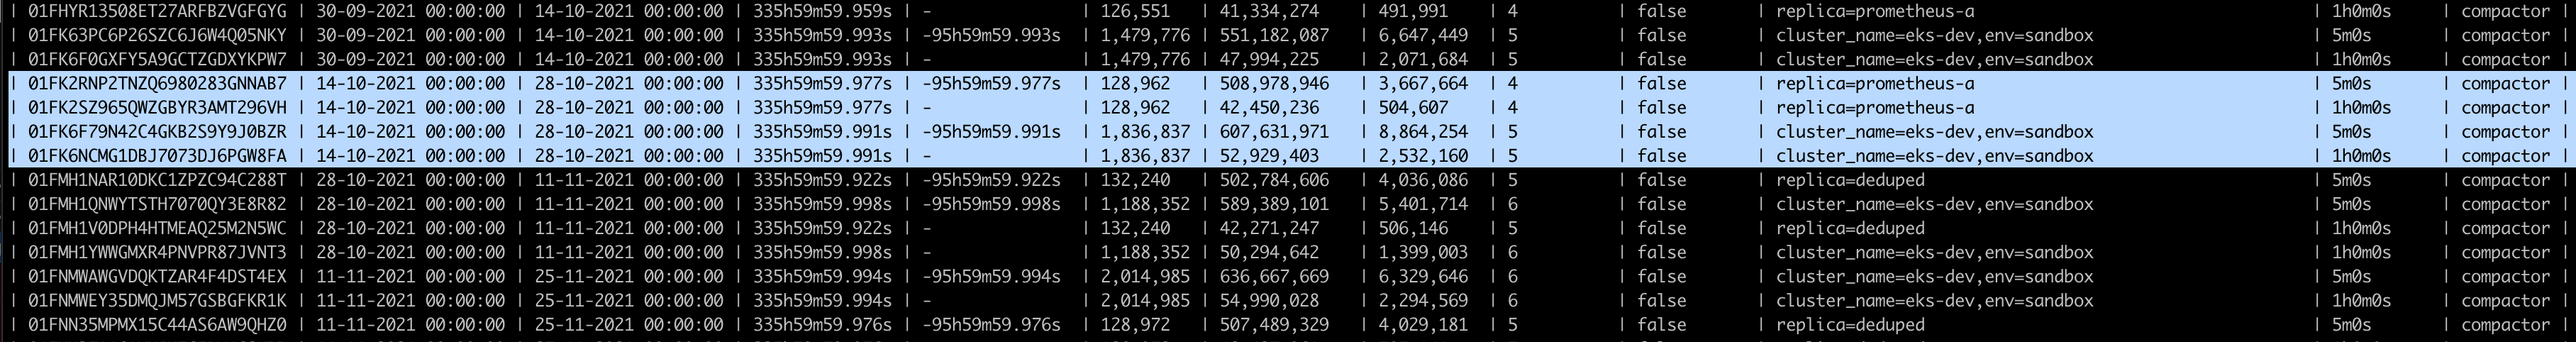
Here is part of the output of : thanos tools bucket inspect
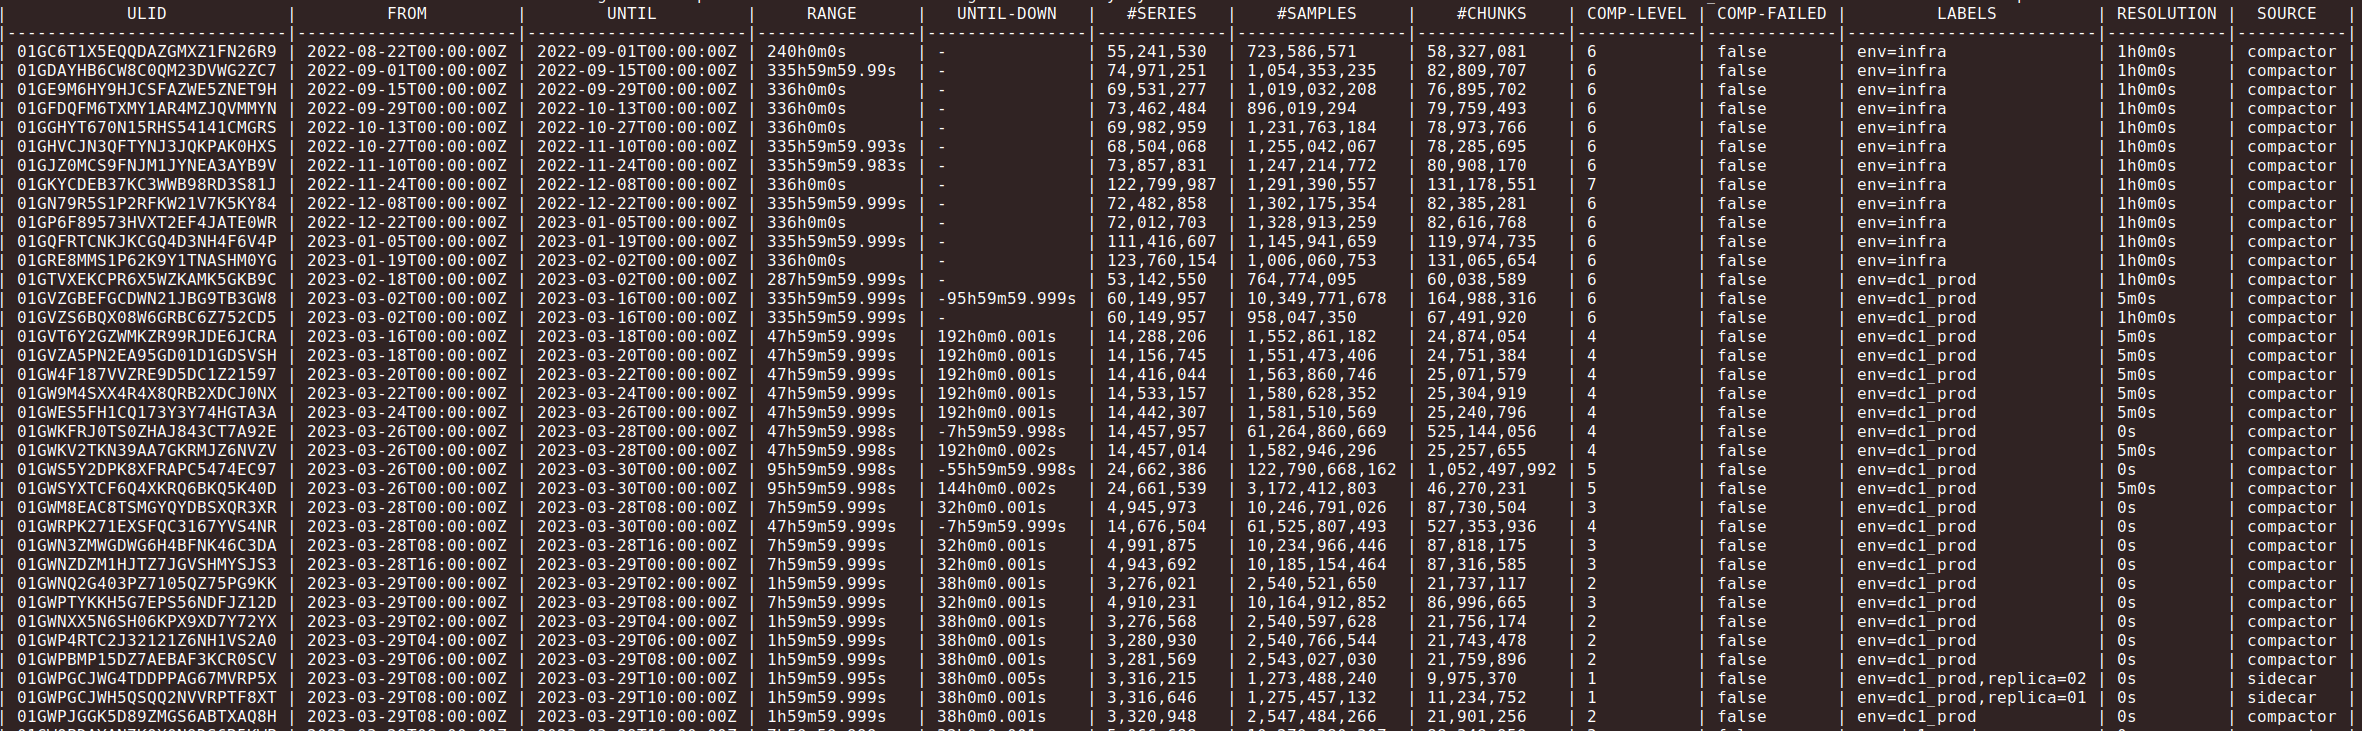
Here is the block output:
So I don't know how to fix this ?
Thanks a lot for your help
Regards
Benj
Hello, After I have restarted thanos query-frontend and thanos store gateway (and his cache) data are come back. It works now. Regards
Hello!
We also encountered the issue.
I added some code and run a debugger. Here's what I've found so far
For chunks, for which the error "sum and count timestamps not aligned" appears, there are extra samples.
Exactly one for AggrCount and one for AggrCounter.
Interestingly, for AggrCount extra is index 0 and it has timestamp lower by downsample.resulution. For AggrCounter extra is the last index and it has the same timestamp as the one before it.
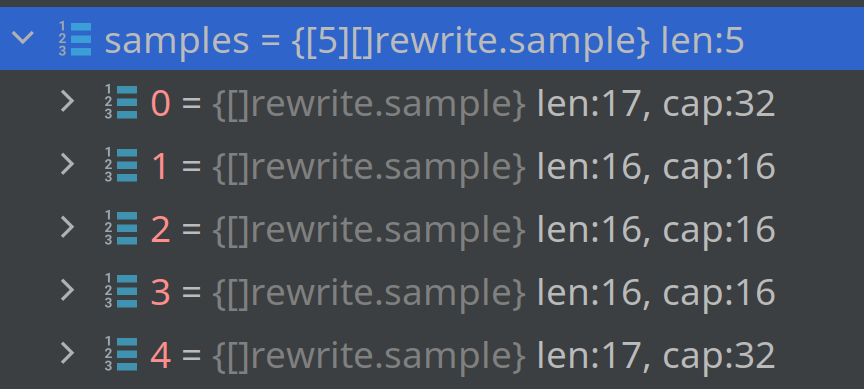
To illustrate, here's the first three elements of AggrCount and AggrSum:
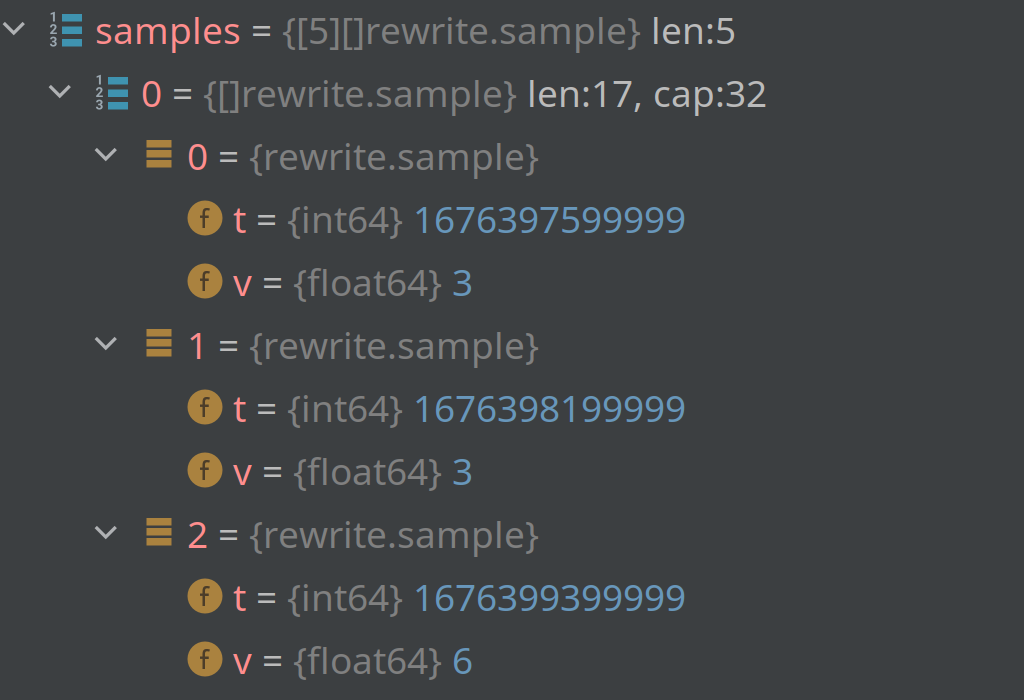
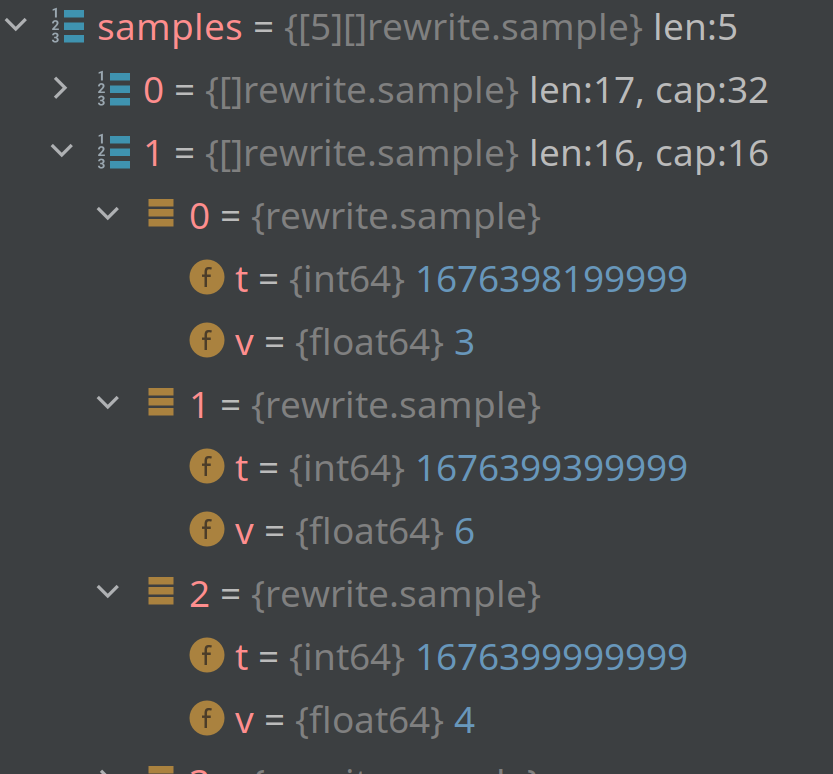
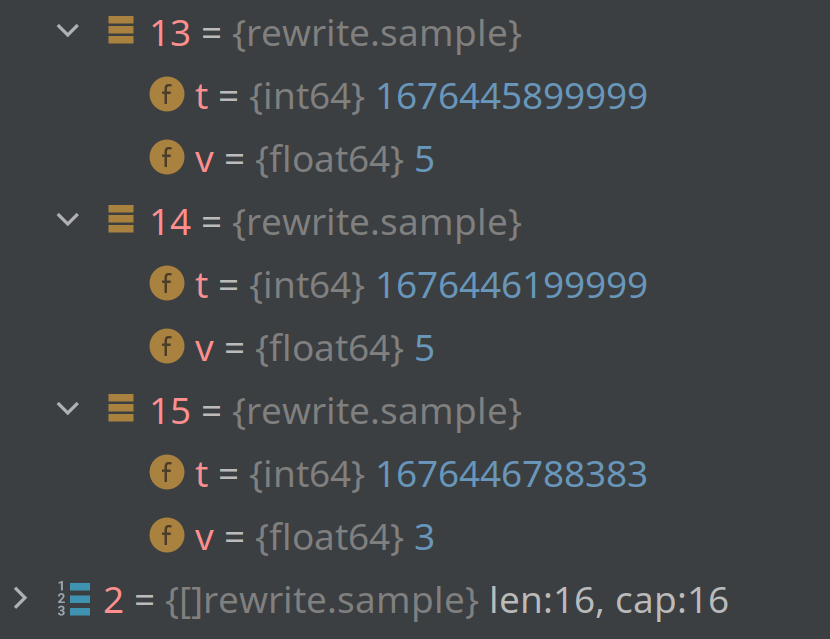
and here's the last three elements of AggrSum and the last four of AggrCounter
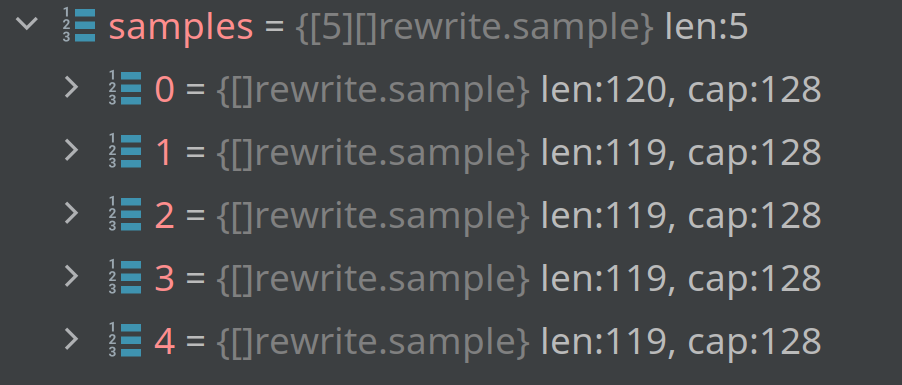
I used slightly modified code from downsample package to find it out. The issue is the same for every chunk, where it's present. Not all chunks are affected.
@yeya24 I want to try and fix broken blocks by rewriting them and removing extra samples. Is it worth doing? I don't quite understand the innards of thanos blocks and how those 5 chunk aggregations are used. I would be grateful for some advice.
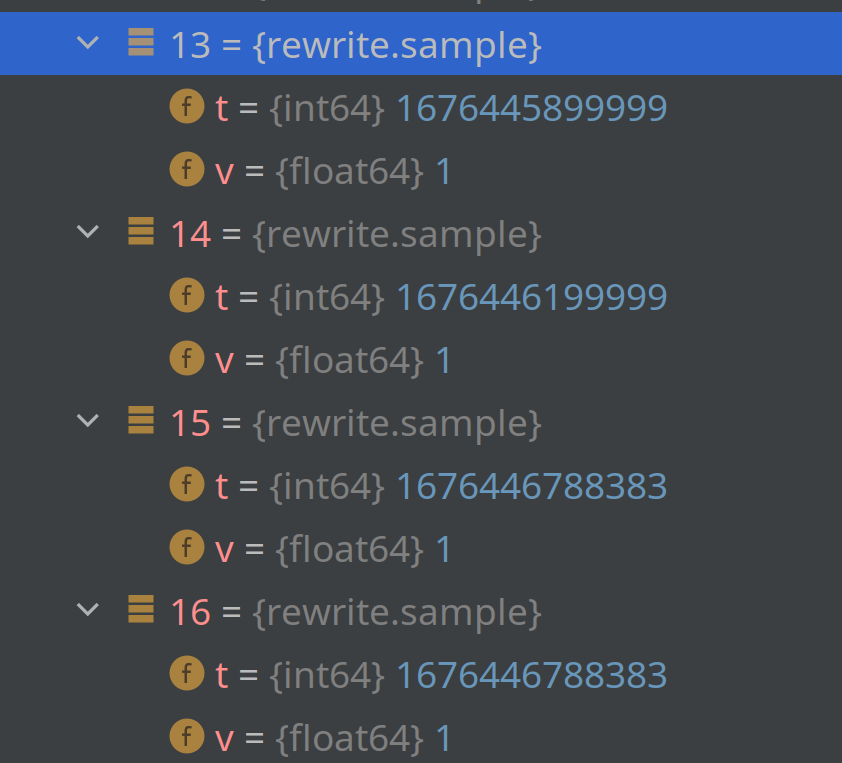
And here's another form of this problem in the same block. Extra sample is only in AggrCount.
also extra samples can be in the middle of AggrCounter
I believe this is due to a bug in downsampling. I have seen it when two aggregates come from separate blocks.
Any update on this issue? We just ran into it after enabling vertical de-duplication in 0.32.0. @xBazilio were you able to fix broken blocks somehow? @yeya24 do you see some way that blocks broken in this way might be fixed?
@verejoel Hi! two things.
I found one problem and fixed it. Good people already merged the PR into main. It'll only work for new downsampled data.
As to already corrupt blocks. I can share my hack in thanos tools bucket rewrite with which I was able to fix data in broken blocks.
https://github.com/xBazilio/thanos/tree/bucket_rewrite
It's based on v0.31.0.
I gathered broken blocks uids and rewritten them with the tool. Literaly, thousands of blocks, 4 years of downsampling. Data is now readable.
If you have raw blocks it's better to delete downsampled data and let fixed compactor downsample it again.
@xBazilio thank you, this might just save us 😅 we have a pretty similar situation (only a year of data though).
Do you need to call this with a relabel config? Or just pass the rewrite command the ids of the corrupted blocks and it will take care of the rest? (if you have an example of how you called it to hand, that would be super)