thanos
 thanos copied to clipboard
Thanos Query Frontend: Caching is inefficient for the queries which have aggregate operators
Thanos, Prometheus and Golang version used: Thanos version: v0.18.0 Prometheus version: v2.24.1
What happened:
Caching on Thanos Query Frontend is not working effectively for the queries which have aggregate function with "by"
Sample Query:
sum(metric_name{label1="", label2="", label=""}) by (label1)
This kind of query through thanos query frontend is always taking the same amount of time to respond. I can see even the downstream Querier is also taking the same amount time only if we hit it directly. So, can not see any difference in the performance when executing this kind of queries even after implementing thanos query frontend .
However, if we remove the "by" part (aggregate over all label dimensions), then the caching is working very well.
Sample Query:
sum(metric_name{label1="", label2="", label=""})
What you expected to happen:
Thanos query frontend should cache the result of the queries which have aggregate over all label dimensions or preserve distinct dimensions by including a without or by clause(by/without)
How to reproduce it (as minimally and precisely as possible):
Sample query:
sum(metric_name{label1="", label2="", label=""}) by (label1)
Use some complex queries that takes some time to load. We cannot see the difference in loading time if we use the simple/short time queries.
Anything else we need to know:
- Thanos Architecture/components:
Thanos Query Frontend + Memcached -> Thanos Querier -> Thanos Store Gateway
Environment:
- All thanos and prometheus related components are deployed as docker containers (Kubernetes)
@anoop2503 Thanks for raising this. However, query frontend caches everything returned by the downstream qurier, no matter your promql query has aggregate operators or not.
I am not sure why you are seeing totally different latencies with and without by. Are you running range queries for both queries? Only range queries results will be cached.
I'm not sure that I am able to reproduce this. Also, I have checked out the source code and looks like the whole query get used as part of the key: https://github.com/thanos-io/thanos/blob/main/pkg/queryfrontend/cache.go#L37
yes @yeya24 I am using the range queries. Please see the queries which I used for checking this.
First Query:
http://test.thanos-frontend.com/graph?g0.range_input=1800s&g0.end_input=2021-05-17%2018%3A35&g0.step_input=30&g0.max_source_resolution=0s&g0.expr=sum%20(rate%20(container_network_receive_bytes_total%7Bimage!%3D%22%22%2Cname%3D~%22%5Ek8s_.*%22%2Cinstance%3D~%22%5E.*%24%22%2Cpod_name%3D~%22.*%22%2Cnamespace%3D~%22%5Eabc-pbb-acd-pbb-w2%7Cads-pbb-acd-pbb-w2%7Cast-pbb-acd-pbb-w2%24%22%7D%5B1m%5D))%20by%20(pod_name)&g0.tab=0
Second Query:
http://test.thanos-frontend.com/graph?g0.range_input=1800s&g0.end_input=2021-05-17%2018%3A35&g0.step_input=30&g0.max_source_resolution=0s&g0.expr=sum%20(rate%20(container_network_receive_bytes_total%7Bimage!%3D%22%22%2Cname%3D~%22%5Ek8s_.*%22%2Cinstance%3D~%22%5E.*%24%22%2Cpod_name%3D~%22.*%22%2Cnamespace%3D~%22%5Eabc-pbb-acd-pbb-w2%7Cads-pbb-acd-pbb-w2%7Cast-pbb-acd-pbb-w2%24%22%7D%5B1m%5D))&g0.tab=0
I can see the caching issue when executing the first query. It takes around 10s to respond with results all the time and sometimes it takes more than 15-20 seconds for the subsequent queries.
But the second query takes around 4s to complete execution first time and takes only 350ms for the subsequent requests.
The only difference between these queries is the first one has "by (pod_name)" with sum function.
@GiedriusS you may not be able to reproduce the issue, if you are executing small queries which takes only short time to complete it's execution. I found this issue when I tried to execute long time queries which takes more than 4s.
Thanks
Again this is not related to the topic of aggregate operators as query frontend doesn't parse promql query so it doesn't know about operators, exprs, etc. But I suspect the first query results are not cached for some reason. Could you please share the cache configuration you are using?
Thanks @yeya24 looking into this. Here is the configuration details.
Deployment:
spec:
      containers:
      - args:
        - query-frontend
        - --http-address=0.0.0.0:9009
        - --query-frontend.downstream-url=http://thanos.my-namespace.svc.cluster.local:10902
        - --query-frontend.compress-responses
        - --query-range.split-interval=12h
        - --labels.split-interval=12h
        - --query-range.max-retries-per-request=3
        - --labels.max-retries-per-request=3
        - --query-range.max-query-parallelism=28
        - --labels.max-query-parallelism=28
        - --query-range.response-cache-max-freshness=1m
        - --labels.response-cache-max-freshness=1m
        - --query-range.response-cache-config-file=/etc/thanos/config.yaml
        - --labels.response-cache-config-file=/etc/thanos/config.yaml
Configmap:
apiVersion: v1
data:
  config.yaml: |
    type: memcached
    config:
      addresses: [thanos-memcached.my-namespace.svc.cluster.local:11211]
      timeout: 500ms
      max_idle_connections: 200
      max_item_size: 1MiB
      max_async_concurrency: 20
      max_async_buffer_size: 10000
      max_get_multi_concurrency: 200
      max_get_multi_batch_size: 0
      dns_provider_update_interval: 10s
      expiration: 24h
kind: ConfigMap
metadata:
  name: thanos-frontend
@anoop2503 Looks like the only way the results are not cached is that the returned response is larger than 1M. I feel it is impossible for your first query?
@yeya24 Is there any easy way to check the exact size of the returned response?
I don't think the returned response is larger than 1M. Anyway I tried increasing the values in the configuration like below. However, I don't see any difference in the performance even after using below configurations.
Updated configmap:
apiVersion: v1
data:
  config.yaml: |
    type: memcached
    config:
      addresses: [thanos-memcached.my-namespace.svc.cluster.local:11211]
      timeout: 500ms
      max_idle_connections: 400
      max_item_size: 250MiB
      max_async_concurrency: 40
      max_async_buffer_size: 10000
      max_get_multi_concurrency: 400
      max_get_multi_batch_size: 0
      dns_provider_update_interval: 10s
      expiration: 24h
kind: ConfigMap
metadata:
  name: thanos-frontend
Memcached configuration:
containers:
      - args:
        - -m 512
        - -p 11211
        image: memcached:1.6.6
        name: thanos-memcached
        ports:
        - containerPort: 11211
          name: clients
          protocol: TCP
        resources:
          limits:
            cpu: 500m
            memory: 1Gi
          requests:
            cpu: 250m
            memory: 512Mi
Can you please check the cache metrics to see your requests really hit the cache or the query result is really cached? Like cortex_cache_hits.
You can also check whether your Memcached has the cached query entry using some Memcached tool.
Besides, a query can only partially hit the cache as well, e.g. only part of the requested time range are cached. In this case, it sends another request to downstream to fetch the results.
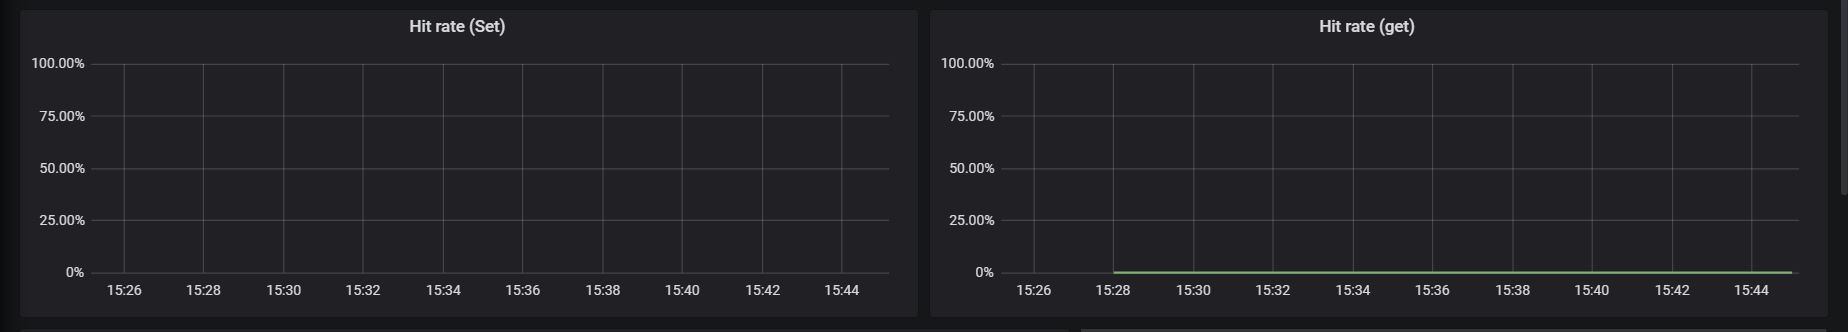
@yeya24 I did a load testing using both queries mentioned above and monitored the metrics for set and get requests. The metrics which I used for checking set and get requests are given below.
Get:
sum (irate (memcached_commands_total{status="hit",command="get"}[5m])) / sum (irate (memcached_commands_total{command="get"}[5m]))
Set:
sum (irate (memcached_commands_total{status="hit",command="set"}[5m])) / sum (irate (memcached_commands_total{command="set"}[5m]))
Seems like the first query with "by" operator (which has the caching issue) does not hit the cache as expected while performing the load test.
However the second query is set the cache in the first request itself and get this cached data for all the subsequent queries (cache hit rate for get request is 100%).
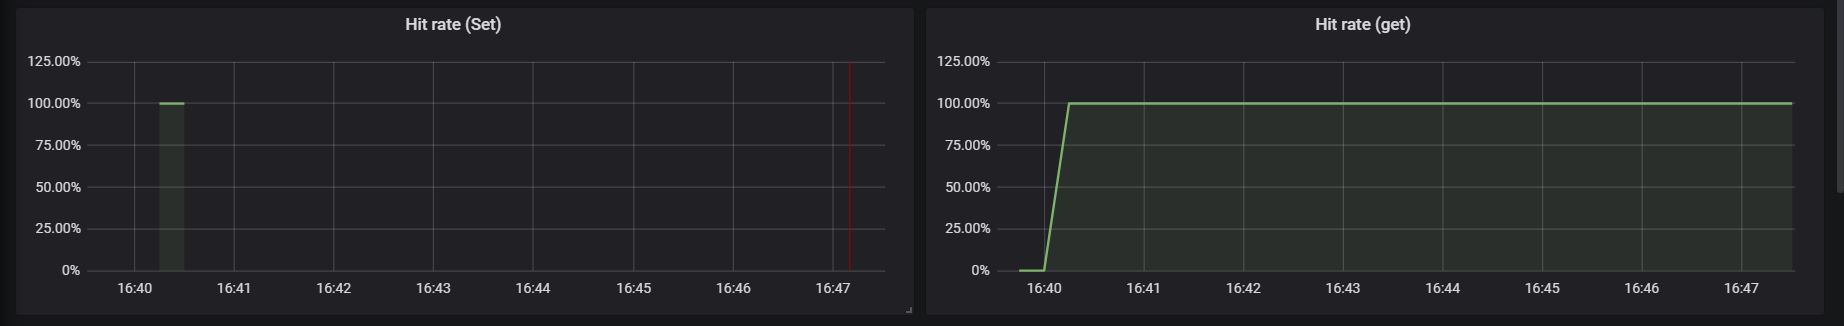
Based on this I believe it does not cache the response of the query which has the aggregate function with "by" operator.
@anoop2503 I don't think the caching part is wrong as query frontend caches response only and it doesn't know what promql is running.
I am not sure why the first query is not cached but it looks like a configuration issue or something else. Please take a look at the metrics exposed by the query frontend first as it tells why these weird things happen in the first place. If it is possible, you can also run the query frontend in your IDE and use a debugger to check the root cause.
I don't really have time on this recently so help wanted. If anyone else sees the same thing, please comment on the issue.
Hello 👋 Looks like there was no activity on this issue for the last two months.
Do you mind updating us on the status? Is this still reproducible or needed? If yes, just comment on this PR or push a commit. Thanks! 🤗
If there will be no activity in the next two weeks, this issue will be closed (we can always reopen an issue if we need!). Alternatively, use remind command if you wish to be reminded at some point in future.
Closing for now as promised, let us know if you need this to be reopened! 🤗
Just noticed this too, reopening.
avg (rate(node_cpu_seconds_total{mode="user",hostname=~".*foo.*"}[1m])) * 100-> cachedavg without (cpu) (rate(node_cpu_seconds_total{mode="user",hostname=~".*foo.*"}[1m])) * 100-> not cached
Actually, I take those words back. Cannot reproduce this now. Probably the items from Memcached get evicted when I sent such heavy queries originally and/or there were intermittent cache connectivity problems. That's what has probably happened in your case as well. Plus, I started writing tests and there is a cache hit even with the by/without operators.
Hello 👋 Looks like there was no activity on this issue for the last two months.
Do you mind updating us on the status? Is this still reproducible or needed? If yes, just comment on this PR or push a commit. Thanks! 🤗
If there will be no activity in the next two weeks, this issue will be closed (we can always reopen an issue if we need!). Alternatively, use remind command if you wish to be reminded at some point in future.