profiler
 profiler copied to clipboard
What's kernel launch time?
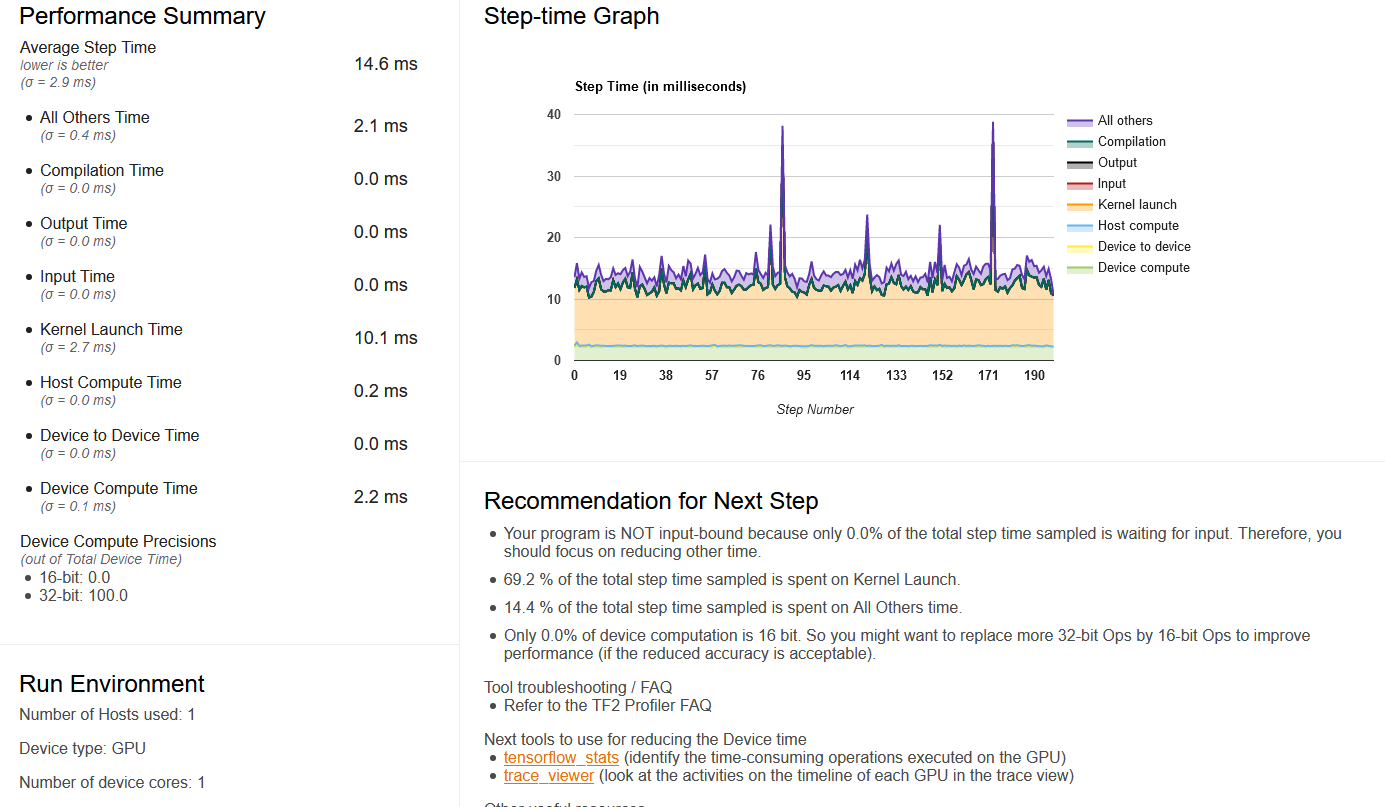
The performance summary shows that my model spend ~50% time in the "kernel launch" step.
I find other items easy to understand, but I have no idea what "kernel launch" is, and how I can reduce its time consumption.
I do complicated preprocessing to my data using the tf.data.Dataset APIs, but the summary shows that I spend no time on it. Could the preprocessing be the real cause of the high "kernel launch" time consumption?

Thanks!
Hi,
"Kernel Launch" time is the time that the CPU spends on launching the GPU compute kernels on the device. It is different from the data preprocessing time in tf.data, which will be counted as "Host Compute" time in this case. If possible, can you upload your entire profile log directory so that I can take a closer look at it? Thanks, -ck
On Mon, Apr 20, 2020 at 1:42 AM leasunhy [email protected] wrote:
The performance summary shows that my model spend ~50% time in the "kernel launch" step. I find other items easy to understand, but I have no idea what "kernel launch" is, and how I can reduce its time consumption. As I do complicated preprocessing to my data using the tf.data.Dataset APIs, but the summary shows that I spend no time on it. Could the preprocessing be the real cause of the high "kernel launch" time consumption?
Thanks!
— You are receiving this because you are subscribed to this thread. Reply to this email directly, view it on GitHub https://github.com/tensorflow/profiler/issues/8, or unsubscribe https://github.com/notifications/unsubscribe-auth/AE33L3K3J7FM2UGMSQHSS7LRNQDGXANCNFSM4MMH2VAA .
Now I see that there is no "Host Compute" time in your step-time graph. It is possible that the tf.data preprocessing time is overlapped with the kernel-launch time. In that case, we will still classify those time as kernel-launch time. Again, if you send me the log, I can understand this better.
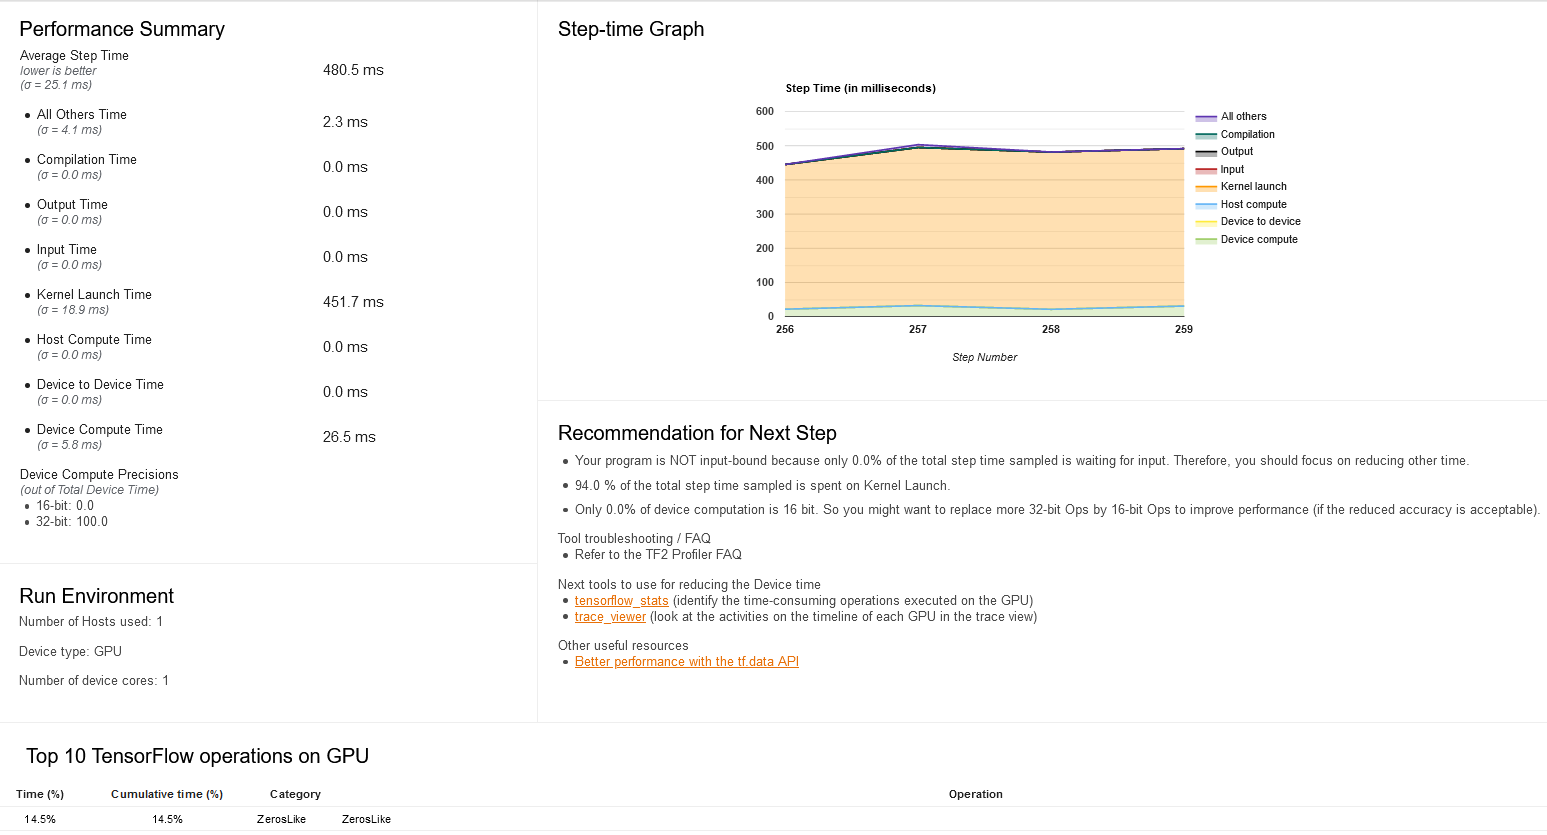
Thanks for providing the log. After inspecting it, I believe that the kernel-launch time is actually overlapped with the tf.data preprocessing time on the CPU. It is possible that the tf.data preprocessing interferes with the kernel launching. You can't do much with the kernel launching, but you can try to reduce the interference of tf.data preprocessing by: (1) Using more parallelism in tf.data preprocessing (https://www.tensorflow.org/guide/data_performance) (2) Using a more powerful CPU (3) Offloading some of the data preprocessing to GPU
Can you try one thing: set the environment variable TF_GPU_THREAD_MODE=gpu_private This will prevent tf.data from interfering the threads that launch kernels on the GPU.
I optimized my data pipeline and the kernel launch time dropped significantly, so my training code now does not suffer from performance issues anymore. Thanks for your explanation @ckluk !
If for improving the profiler you need the logs after setting the environment variable, I can help to collect them.
Nice to know that the performance issues are gone. Yes, for improving the profiler, it would be great if we can get: (1) The profile after setting the environment variable (2) The profile with all your optimizations
Thanks a lot! -ck
On Mon, Apr 27, 2020 at 9:27 AM leasunhy [email protected] wrote:
I optimized my data pipeline and the kernel launch time dropped significantly, so my training code now does not suffer from performance issues any more. Thanks for your explanation @ckluk https://github.com/ckluk !
If for improving the profiler you need the logs after setting the environment variable, I can help to collect them.
— You are receiving this because you were mentioned. Reply to this email directly, view it on GitHub https://github.com/tensorflow/profiler/issues/8#issuecomment-620092516, or unsubscribe https://github.com/notifications/unsubscribe-auth/AE33L3LI5QM7CDPW6QXFSHLROWW57ANCNFSM4MMH2VAA .
Thanks for providing the log. After inspecting it, I believe that the kernel-launch time is actually overlapped with the tf.data preprocessing time on the CPU. It is possible that the tf.data preprocessing interferes with the kernel launching. You can't do much with the kernel launching, but you can try to reduce the interference of tf.data preprocessing by: (1) Using more parallelism in tf.data preprocessing (https://www.tensorflow.org/guide/data_performance) (2) Using a more powerful CPU (3) Offloading some of the data preprocessing to GPU
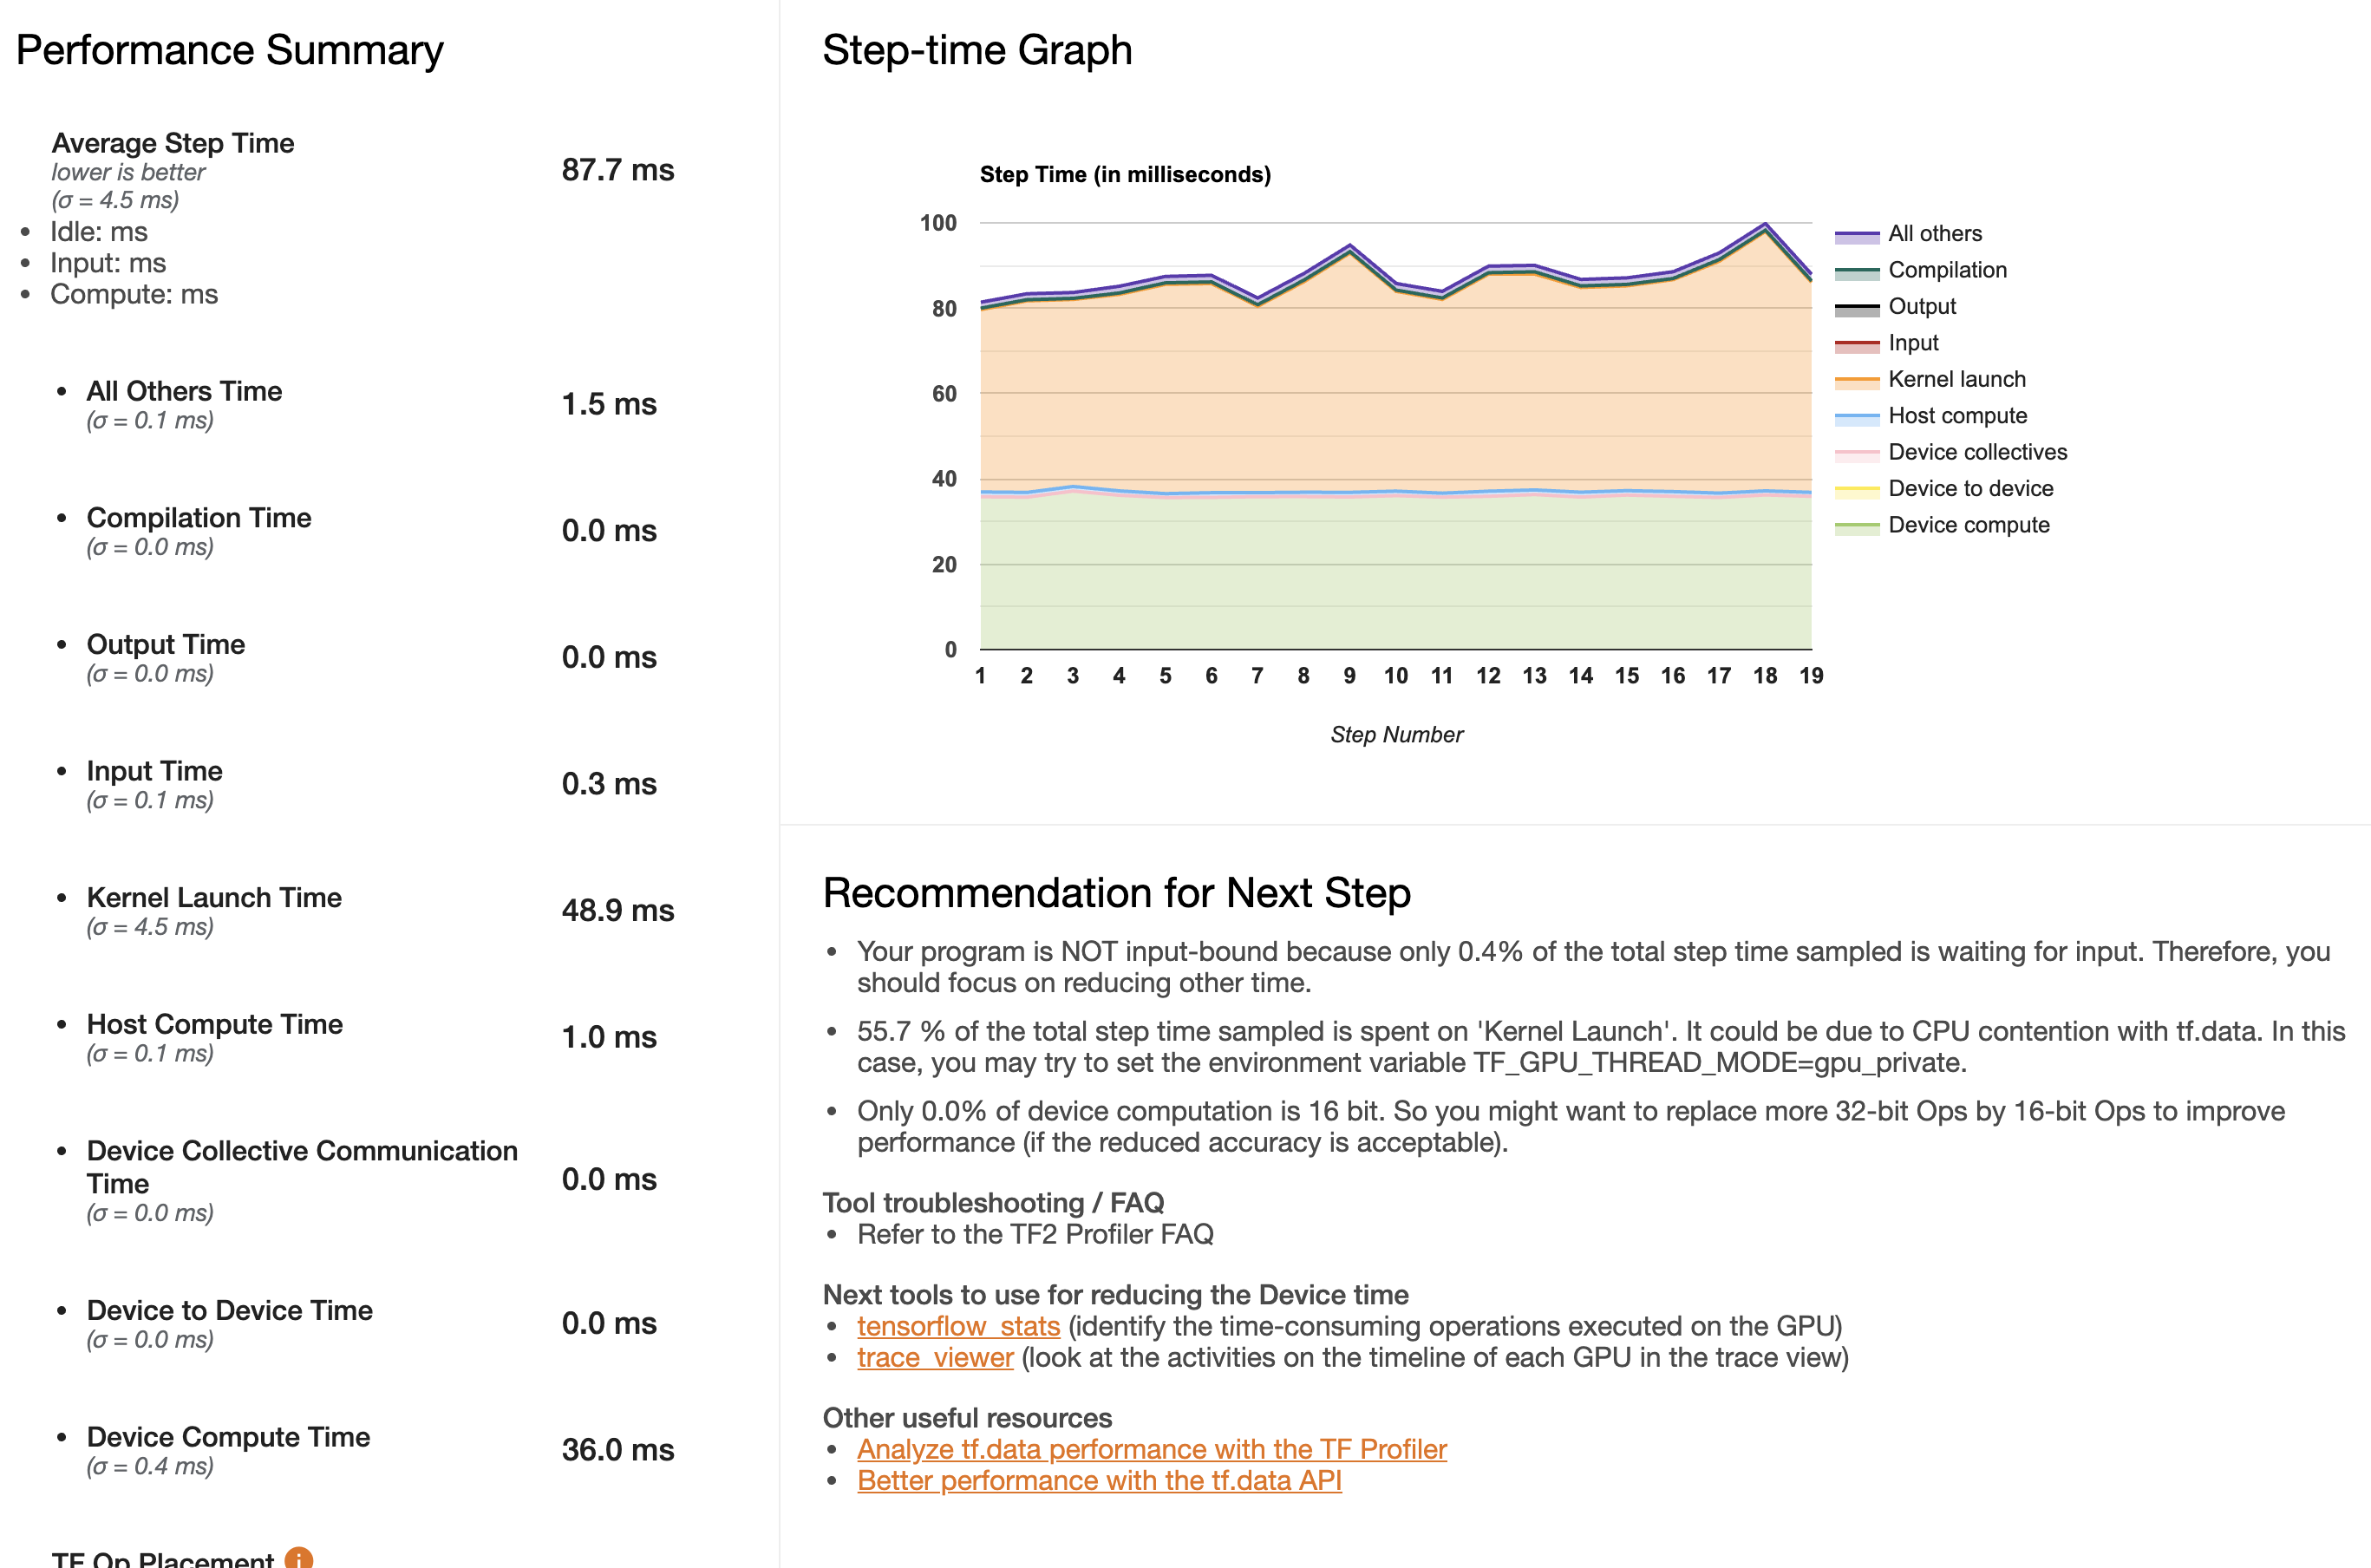
Hi there @ckluk ! How did you determine that tf.data preprocessing was responsible for the high Kernel Launch time? I have a similar problem with over 80% spent on kernel launch but not sure how to determine what is responsible in particular.
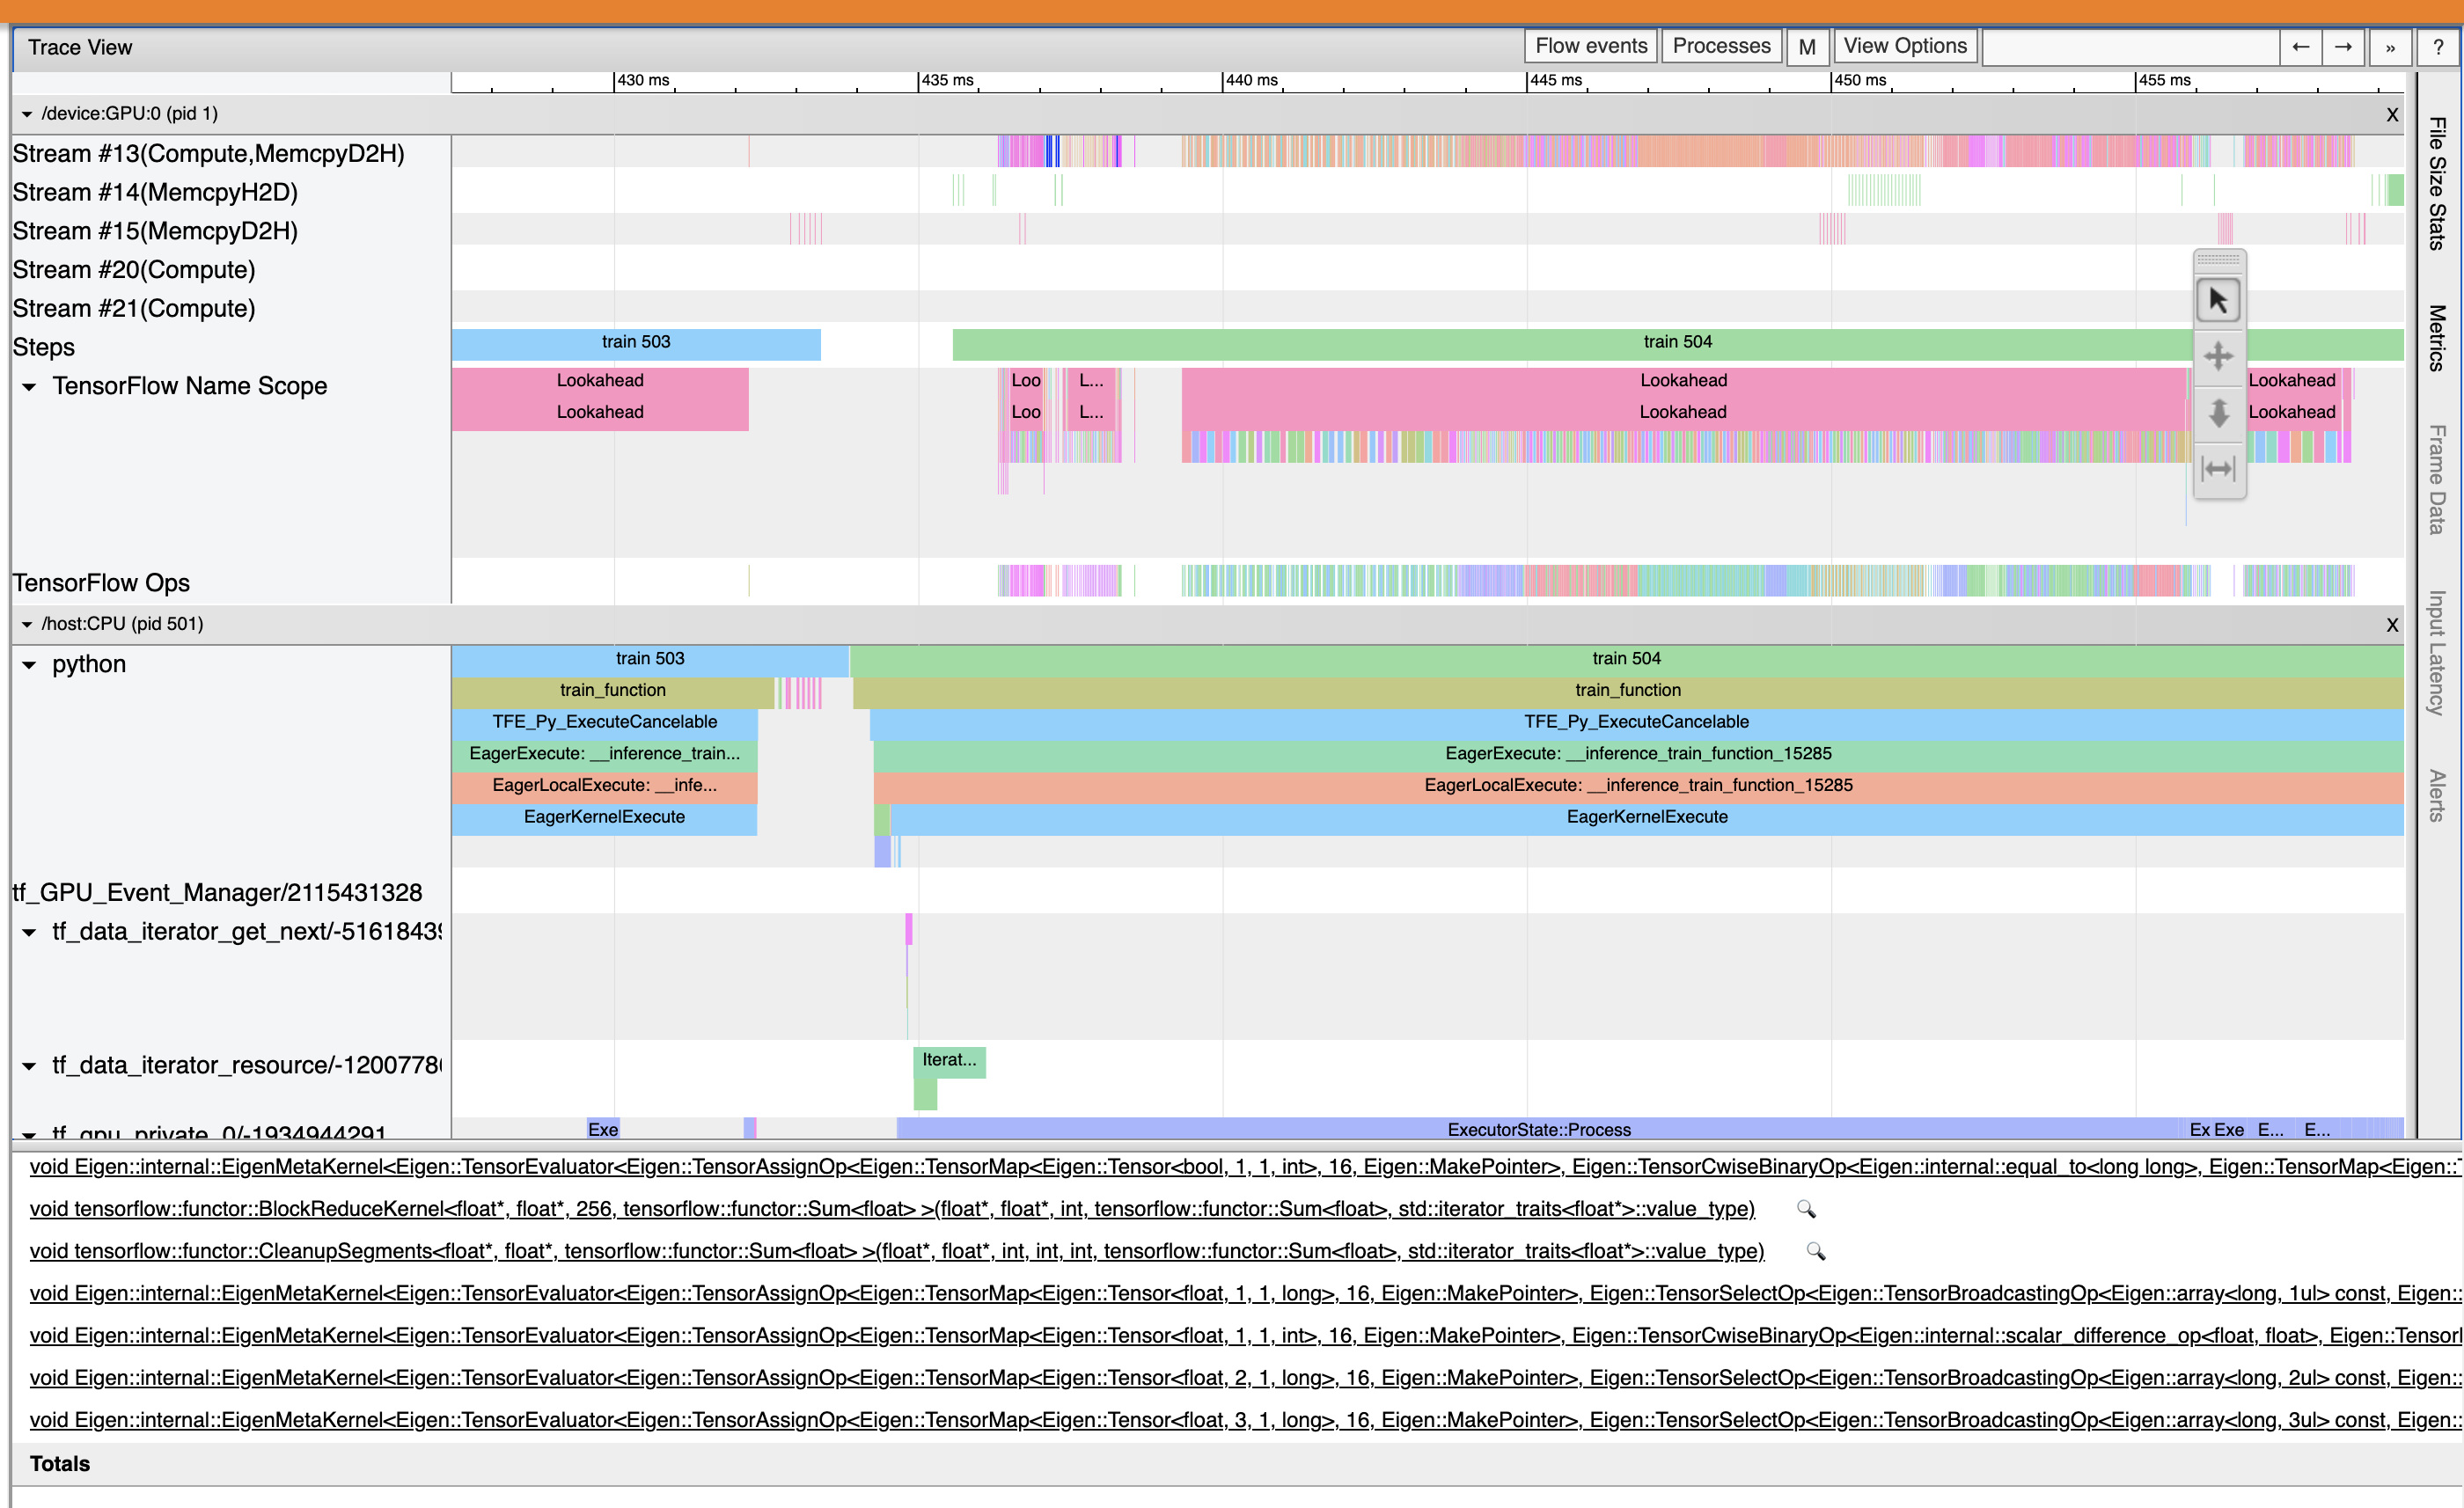
What I did was to go to the trace_viewer to see if kernel-launch events are overlapped with tf.data events. Another possible reason for large percent of time spent on kernel launch is that the GPU kernels are too short in execution time, and as a result the kernel launching overhead dominates.
On Tue, May 26, 2020 at 9:17 AM Jacob Moss [email protected] wrote:
Thanks for providing the log. After inspecting it, I believe that the kernel-launch time is actually overlapped with the tf.data preprocessing time on the CPU. It is possible that the tf.data preprocessing interferes with the kernel launching. You can't do much with the kernel launching, but you can try to reduce the interference of tf.data preprocessing by: (1) Using more parallelism in tf.data preprocessing ( https://www.tensorflow.org/guide/data_performance) (2) Using a more powerful CPU (3) Offloading some of the data preprocessing to GPU
Hi there @ckluk https://github.com/ckluk ! How did you determine that tf.data preprocessing was responsible for the high Kernel Launch time? I have a similar problem with over 80% spent on kernel launch but not sure how to determine what is responsible in particular.
— You are receiving this because you were mentioned. Reply to this email directly, view it on GitHub https://github.com/tensorflow/profiler/issues/8#issuecomment-634127408, or unsubscribe https://github.com/notifications/unsubscribe-auth/AE33L3OVYDKH3FXWG5OHA63RTPTTNANCNFSM4MMH2VAA .
Hi @ckluk , glad to find your answer here. I'm experiencing the same issue with high 'kernel launch' time, and I did try to set the environment variable TF_GPU_THREAD_MODE=gpu_private but in vain. How come...

And here's the profile if you're interested to dig into it. profile.zip
Hi,
I took a look at the trace viewer result in your profile. It seems that the spikes in step time are related to the use of py_func. Did you use py_func in your model? [image: image.png]
On Tue, Jun 2, 2020 at 6:47 AM Jonathan Zhang [email protected] wrote:
Hi @ckluk https://github.com/ckluk , glad to find your answer here. I'm experiencing the same issue with high 'kernel launch' time, and I did try to set the environment variable TF_GPU_THREAD_MODE=gpu_private but in vain. How come...
[image: Screen Shot 2020-06-02 at 9 38 23 PM] https://user-images.githubusercontent.com/1680881/83526870-a3420600-a519-11ea-87e7-c86b83401d52.png
And here's the profile if you're interested to dig into it. profile.zip https://github.com/tensorflow/profiler/files/4717511/profile.zip
— You are receiving this because you were mentioned. Reply to this email directly, view it on GitHub https://github.com/tensorflow/profiler/issues/8#issuecomment-637554533, or unsubscribe https://github.com/notifications/unsubscribe-auth/AE33L3NLWLS5VYSWYI5VSPTRUT7GXANCNFSM4MMH2VAA .
Thanks for your swift reply. I used tf.numpy_function to be exact. I can barely remember how I came to this function as I was struggling with data loading from MySQL via tf.data pipeline, it was my final resort due to nested data structure (e.g. a dict) and compatibility with eager mode or something...
Should I remove/replace it with something else? Here's the code pertaining to this part in case you're interested:
def mapfunc(bno):
    ret = tf.numpy_function(func=_loadTrainingData,
                            inp=[bno],
                            Tout=[tf.float32, tf.int32, tf.float32])
            # f = py_function(func=_loadTrainingData,
            #                 inp=[bno],
            #                 Tout=[{
            #                     'features': tf.float32,
            #                     'seqlens': tf.int32
            #                 }, tf.float32])
    feat, seqlens, corl = ret

    feat.set_shape((None, max_step, feat_size))
    seqlens.set_shape((None, 1))
    corl.set_shape((None, 1))

    return {'features': feat, 'seqlens': seqlens}, corl

ds_train = tf.data.Dataset.from_tensor_slices(bnums).map(
    lambda bno: tuple(mapfunc(bno)),
    _prefetch).prefetch(_prefetch)
Hi, I took a look at the trace viewer result in your profile. It seems that the spikes in step time are related to the use of py_func. Did you use py_func in your model? [image: image.png] … On Tue, Jun 2, 2020 at 6:47 AM Jonathan Zhang @.***> wrote: Hi @ckluk https://github.com/ckluk , glad to find your answer here. I'm experiencing the same issue with high 'kernel launch' time, and I did try to set the environment variable TF_GPU_THREAD_MODE=gpu_private but in vain. How come... [image: Screen Shot 2020-06-02 at 9 38 23 PM] https://user-images.githubusercontent.com/1680881/83526870-a3420600-a519-11ea-87e7-c86b83401d52.png And here's the profile if you're interested to dig into it. profile.zip https://github.com/tensorflow/profiler/files/4717511/profile.zip — You are receiving this because you were mentioned. Reply to this email directly, view it on GitHub <#8 (comment)>, or unsubscribe https://github.com/notifications/unsubscribe-auth/AE33L3NLWLS5VYSWYI5VSPTRUT7GXANCNFSM4MMH2VAA .
I could be wrong, but this use of numpy functions seems to be causing the slowdown (in other words, those numpy functions are on the critical path). If you can replace them with a faster alternative, it would probably help.
On Tue, Jun 2, 2020 at 6:59 PM Jonathan Zhang [email protected] wrote:
Thanks for your swift reply. I used tf.numpy_function to be exact. I can barely remember how I came to this function as I was struggling with data loading from MySQL via tf.data pipeline, it was my final resort due to nested data structure (e.g. a dict) and compatibility with eager mode or something...
Should I remove/replace it with something else? Here's the code pertaining to this part in case you're interested:
def mapfunc(bno):
ret = tf.numpy_function(func=_loadTrainingData,

                        inp=[bno],

                        Tout=[tf.float32, tf.int32, tf.float32])

        # f = py_function(func=_loadTrainingData,

        #                 inp=[bno],

        #                 Tout=[{

        #                     'features': tf.float32,

        #                     'seqlens': tf.int32

        #                 }, tf.float32])

feat, seqlens, corl = ret


feat.set_shape((None, max_step, feat_size))

seqlens.set_shape((None, 1))

corl.set_shape((None, 1))


return {'features': feat, 'seqlens': seqlens}, corl
ds_train = tf.data.Dataset.from_tensor_slices(bnums).map(
lambda bno: tuple(mapfunc(bno)),

_prefetch).prefetch(_prefetch)
Hi, I took a look at the trace viewer result in your profile. It seems that the spikes in step time are related to the use of py_func. Did you use py_func in your model? [image: image.png] … <#m_7125139436256249974_> On Tue, Jun 2, 2020 at 6:47 AM Jonathan Zhang @.***> wrote: Hi @ckluk https://github.com/ckluk https://github.com/ckluk , glad to find your answer here. I'm experiencing the same issue with high 'kernel launch' time, and I did try to set the environment variable TF_GPU_THREAD_MODE=gpu_private but in vain. How come... [image: Screen Shot 2020-06-02 at 9 38 23 PM] https://user-images.githubusercontent.com/1680881/83526870-a3420600-a519-11ea-87e7-c86b83401d52.png And here's the profile if you're interested to dig into it. profile.zip https://github.com/tensorflow/profiler/files/4717511/profile.zip — You are receiving this because you were mentioned. Reply to this email directly, view it on GitHub <#8 (comment) https://github.com/tensorflow/profiler/issues/8#issuecomment-637554533>, or unsubscribe https://github.com/notifications/unsubscribe-auth/AE33L3NLWLS5VYSWYI5VSPTRUT7GXANCNFSM4MMH2VAA .
— You are receiving this because you were mentioned. Reply to this email directly, view it on GitHub https://github.com/tensorflow/profiler/issues/8#issuecomment-637907889, or unsubscribe https://github.com/notifications/unsubscribe-auth/AE33L3MBIUKSJUXNK5YQ4GLRUWVB5ANCNFSM4MMH2VAA .
I'm on the same boat - the kernal lunch time is exceptionally high. TF_GPU_THREAD_MODE=gpu_private did not help in my case either
I also include the profile files here. Any insights will be very much appreciated! thx in advance! profile.zip
Hi Yan
I looked at your profile. I think the cause of the high kernel-launch overhead is that the granularity of GPU kernel sis too small and so the launching overhead dominates. There are two possible ways which may help: (1) Use the XLA compiler, which can fuse multiple TF Ops into the same kernel (see https://www.tensorflow.org/xla). (2) Rewrite your TF code in a way to create larger granularity of computation on the GPU.
Ccing [email protected] who knows this topic much better.
Thanks, -ck
On Wed, Jun 3, 2020 at 11:23 AM Yan Tang [email protected] wrote:
I'm on the same boat - the kernal lunch time is exceptionally high. TF_GPU_THREAD_MODE=gpu_private did not help in my case either
[image: Capture] https://user-images.githubusercontent.com/4408568/83673195-16409080-a59d-11ea-89bd-88987e191b7f.PNG
I also include the profile files here. Any insights will be very much appreciated! thx in advance! profile.zip https://github.com/tensorflow/profiler/files/4725405/profile.zip
— You are receiving this because you were mentioned. Reply to this email directly, view it on GitHub https://github.com/tensorflow/profiler/issues/8#issuecomment-638377167, or unsubscribe https://github.com/notifications/unsubscribe-auth/AE33L3N2JP23BTFYZ7P77TLRU2IIZANCNFSM4MMH2VAA .
Hi, I'm also experiencing extremely high kernel launch time:
Here is the raw profile data
2020_06_11_14_32_06.zip
I tried to write everything in tf ops and use @tf.function, but it seems that the performance is even as low as computing on CPU. This really annoying me for weeks. Any helpful idea will be greatly appreciated!
I tried to force compile using @tf.function(experimental_compile=True) but it failed. It says there are uncompilable nodes like this:
FFT2D_1: unsupported op: No registered 'FFT2D' OpKernel for XLA_GPU_JIT devices compatible with node {{node FFT2D_1}}
	 (OpKernel was found, but attributes didn't match) Requested Attributes: Tcomplex=DT_COMPLEX128
	Stacktrace:
		Node: StatefulPartitionedCall, function:
		Node: FFT2D_1, function: __forward_model_1933
As I mentioned before, I think XLA may help. Ccing Sanjoy for the XLA issue that you encountered.
On Wed, Jun 17, 2020 at 6:52 AM zzjjbb [email protected] wrote:
I tried to force compile using @tf.function(experimental_compile=True) but it failed. It says there are uncompilable nodes like this:
FFT2D_3: unsupported op: No registered 'FFT2D' OpKernel for XLA_CPU_JIT devices compatible with node {{node FFT2D_3}} (OpKernel was found, but attributes didn't match) Requested Attributes: Tcomplex=DT_COMPLEX128 Stacktrace: Node: StatefulPartitionedCall, function: Node: FFT2D_3, function: __forward_model_922
— You are receiving this because you were mentioned. Reply to this email directly, view it on GitHub https://github.com/tensorflow/profiler/issues/8#issuecomment-645386714, or unsubscribe https://github.com/notifications/unsubscribe-auth/AE33L3N4SPZCITY7ZIJ5YB3RXDDA3ANCNFSM4MMH2VAA .
As the error message says, we don't yet support complex128 on FFT2D. As a workaround can you try using FFT2D with complex64?
The right fix is to add support for complex128 FFT2D, but we don't have cycles to look into this in the next few weeks at least. But I'm happy to review PRs adding such support.
@ckluk Hi, I also encounter this problem. After checking the profiles uploaded, it's still difficult for me to find the exact operations that I should edit in my codes. It seems there are frequent ops between host and device. Not sure if my guess is correct. Could you help me?


Hi Slyne,
Usually, high kernel launch overhead is not due to a particular op. Instead, it is because there is insufficient computation in the ops executed on the device to amortize the kernel launch overhead. So, following suggestions from one of my previous replies may still be helpful: (1) Use the XLA compiler, which can fuse multiple TF Ops into the same kernel (see https://www.tensorflow.org/xla). (2) Rewrite your TF code in a way to create larger granularity of computation on the GPU. In particular, have you tried (1)?
On Wed, Jan 13, 2021 at 4:35 AM Slyne Deng [email protected] wrote:
@ckluk https://github.com/ckluk Hi, I also encounter this problem. After checking the profiles uploaded, it's still difficult for me to find the exact operations that I should edit in my codes. It seems there are frequent ops between host and device. Not sure if my guess is correct. Could you help me? Uploading 2021_01_13_19_07_07.zip… [image: StepTime] https://user-images.githubusercontent.com/6286804/104453007-be601280-55de-11eb-8498-8a4d4649cd85.JPG
— You are receiving this because you were mentioned. Reply to this email directly, view it on GitHub https://github.com/tensorflow/profiler/issues/8#issuecomment-759420428, or unsubscribe https://github.com/notifications/unsubscribe-auth/AE33L3OORZMZ4SVVSKQZ6H3SZWHR7ANCNFSM4MMH2VAA .
@ckluk Thank you! Yes, I've enabled XLA. It turns out I should not measure the beginning steps of a training epoch because my data is not equally distributed. The first serveral steps have much smaller size data. And the second epoch takes much less time (from 10421 s to 3971 s). After changing the measure steps to be in the middle part of an epoch, I found the the bottleneck is IO. I have over 1000000 sample files to read. At first, I used parallel_map to read these files as training goes but the IO problem cannot be solved. Now I use tf-records to store the data on disk and the performance seems much better. But tf profiler still complains ops on host should be as smaller as possible. (I don't have any preprocessing steps on host.)
 def _read_labeled_tfrecord(example):
            LABELED_TFREC_FORMAT = {
                "samples": tf.io.FixedLenFeature([], tf.string),
                "labels": tf.io.FixedLenFeature([], tf.string),
            }
            example = tf.io.parse_single_example(example, LABELED_TFREC_FORMAT)
            samples = tf.io.parse_tensor(example['samples'], tf.float32)
            labels = tf.io.parse_tensor(example['labels'], tf.int32)
            return samples, labels
 ds = tf.data.TFRecordDataset(filenames, num_parallel_reads=tf.data.AUTOTUNE)\
                .map(_read_labeled_tfrecord, num_parallel_calls=tf.data.AUTOTUNE)\
                .shuffle(shuffle_size)\
                .padded_batch(batch_size, padded_shapes=(tf.TensorShape([None]),tf.TensorShape([None])))\
                .prefetch(tf.data.AUTOTUNE)
My dataset is audio samples with their transcripts. The sample shape can be quite dynamic. Not sure if it would be better if I pad the samples to the same size (serveral buckets)?
@ckluk thanks for a great tool.
I am having the same issue as others on this thread with a large time spent on kernel launch.
I have set TF_GPU_THREAD_MODE (btw, is there a way to validate this has had the desired effect?), and I have also setup XLA which is working looking at the profiler trace view, but with no real improvement - the GPU is idle most of the time, yet my program is not I/O bound.
Do you have some other suggestions one can explore?
Thanks in advance, D
@leasunhy what did you do in data pipeline? I meet the same question...
I am facing similar issues. ~~Enabling XLA gave me about a 2X if my notes are correct~~ edit 2: not actually, when "SubProcess ended with return code: 0" occurs when XLA is enabled, any benifits from XLA are lost by the interrupt. Things seem slower than they should be given that my GPU and CPU are both underutilized. According to task manager, CUDA usage is sitting around 30% and CPU usage is sitting around 20%. GPU memory sitting at about 0.6GB/4GB.
I am using TF data with parallel interleaves and maps to read and preprocess my data. Tensorboard Profiling overview page says "Your program is NOT input-bound because only 0.1% of the total step time sampled is waiting for input. Therefore, you should focus on reducing other time." and 67.1 % of the total step time sampled is spent on 'Kernel Launch'. Wall clock time of kernel launch is 72.8 ms per step, which seems high.
I am using a small batch size (8), but am trying to compensate for the lost computational efficiency by using the steps_per_execution parameter of model.compile in Keras.
I am compiling a custom sub-classed Keras model and layers.
I frequently receive "SubProcess ended with return code: 0" during my training process, which seems to interfere with training time and might be correlated with the kernel launch time. Not sure what it is caused by.
Edit 1: I tried the tf.function(experimental_compile=True) as well and received the following error:
2021-03-20 04:00:32,138 - WARNING -  Function invoked by the following node is not compilable: node StatefulPartitionedCall (defined at REDACTED)  = StatefulPartitionedCall[Tin=[DT_FLOAT, DT_INT64, DT_INT64, DT_INT64, DT_RESOURCE, ..., DT_RESOURCE, DT_RESOURCE, DT_RESOURCE, DT_RESOURCE, DT_RESOURCE], Tout=[DT_FLOAT, DT_FLOAT], _XlaHasReferenceVars=false, _XlaMustCompile=true, _class=["loc:@Func/cond_1/then/_10/input/_34"], _collective_manager_ids=[], _input_hostmem=[0, 1, 2, 4, 5, ..., 154, 155, 156, 157, 158], _read_only_resource_inputs=[163, 164], config="", config_proto="\n\007\n\0...02\001\000", executor_type="", f=__inference_train_step_17176[], _device="/job:localhost/replica:0/task:0/device:GPU:0"](RaggedFromVariant/RaggedTensorFromVariant/_2, RaggedFromVariant/RaggedTensorFromVariant/_4, RaggedFromVariant/RaggedTensorFromVariant/_6, IteratorGetNext/_8, unknown, unknown_0, unknown_1, unknown_2, unknown_3, unknown_4, ...).
2021-03-20 04:00:32,139 - WARNING - Uncompilable nodes:
2021-03-20 04:00:32,139 - WARNING - RaggedToTensor/RaggedTensorToTensor: unsupported op: No registered 'RaggedTensorToTensor' OpKernel for XLA_GPU_JIT devices compatible with node {{node RaggedToTensor/RaggedTensorToTensor}}
2021-03-20 04:00:32,139 - WARNING - 	Stacktrace:
2021-03-20 04:00:32,139 - WARNING - 		Node: StatefulPartitionedCall, function:
2021-03-20 04:00:32,139 - WARNING - 		Node: transforecaster/StatefulPartitionedCall, function: __inference_train_step_17176
2021-03-20 04:00:32,139 - WARNING - 		Node: RaggedToTensor/RaggedTensorToTensor, function: __forward_call_12192
Edit 2: Moved the ragged tensor to tensor conversion out of the model and in to the tf.data preprocessing, allowing XLA to run without error. Noticed that "SubProcess ended with return code: 0" is related to XLA.
Added the environment variables and tf config below to no benefit. Note I did this in a top-level init.py before any tf ops.
os.environ["TF_GPU_THREAD_MODE"] = "gpu_private"
os.environ["TF_GPU_THREAD_COUNT"] = "6"  # Note I have 12 threads to work with
tf.config.experimental_run_functions_eagerly(False)
Added the tf.data.Options below to no benefit.
options = tf.data.Options()
options.experimental_optimization.apply_default_optimizations = False
options.experimental_optimization.autotune_buffers = True
options.experimental_optimization.autotune = True
options.experimental_optimization.autotune_cpu_budget = 6  # Note I have 12 threads to work with
options.experimental_slack = True
My tf.data pipeline is below. _parse_tf_record is compute heavy since it applies a rolling window to generate time-series input.
 dataset = tf.data.Dataset.list_files(
        Path(tf_record_root, '*.tfrecord').__str__()
    ) \
        .shuffle(buffer_size=glob.glob(Path(tf_record_root, '*.tfrecord').__str__()).__len__()) \
        .interleave(lambda filename: tf.data.TFRecordDataset(filename),
                    num_parallel_calls=tf.data.experimental.AUTOTUNE) \
        .map(partial(_parse_tf_record, max_seq_len=int(config['Model']['max_seq_len'])),
             num_parallel_calls=tf.data.experimental.AUTOTUNE) \
        .interleave(lambda x: x,
                    num_parallel_calls=tf.data.experimental.AUTOTUNE) \
        .shuffle(buffer_size=50000, reshuffle_each_iteration=True) \
        .repeat() \
        .apply(tf.data.experimental.dense_to_ragged_batch(batch_size=int(config['Model']['batch_size']))) \
        .interleave(lambda x, y: tf.data.Dataset.from_tensors((x.to_tensor(), y)),
                    num_parallel_calls=tf.data.experimental.AUTOTUNE) \
        .apply(tf.data.experimental.copy_to_device('/gpu:0')) \  # Attempted to reduce gap between steps
        .apply(tf.data.experimental.prefetch_to_device('/gpu:0', buffer_size=tf.data.experimental.AUTOTUNE))  # Attempted to reduce gap between steps
Edit 3: If I enable XLA and wait long enough, the "SubProcess ended with return code: 0" message stops printing so frequently and the run time is improved. I have now succeeded in getting ~80% CUDA usage on my GPU with XLA enabled and a higher batch size. Still low CPU usage but I think my GPU is just a bottleneck in this case.
steps_per_execution doesn't seem to work for me (I think it is TPU only?)
hello everyone,
I am facing the same issue with TF2.4.1 + cuda11.0 + P40 GPU.
The GPU utilization is only 40%.
I have tried the XLA, but unfortunately it cant run with distributed training.
Below is the trace viewer, but I dont know how to findout what is the problem.
Can anyone please give some help? tensorboard.tar.gz
hello everyone,
I am facing the same issue with TF2.4.1 + cuda11.0 + P40 GPU.
The GPU utilization is only 40%.
I have tried the
XLA, but unfortunately it cant run with distributed training.Below is the trace viewer, but I dont know how to findout what is the problem.
Can anyone please give some help? tensorboard.tar.gz
I Have same problem with u
To debug this, I removed all the layers and then added each layer one by one. I found that LSTM/GRU layers added the majority (90%) of the kernel launch time. Furthermore, kernel launch time was directly proportional to the RNN length. I guess this is expected because some computation of the RNN has to be done on the CPU & it has to get data from GPU & then launch a new kernel for each step of the RNN.
To improve training time, I modified some parameters to ensure that cuDNN was used by RNN layers (https://www.tensorflow.org/api_docs/python/tf/keras/layers/GRU) & also switched from LSTM to GRU. For the inference time, the only way to get an acceptable response time for my application was to use the CPU for inference. With CPU, inference time decreased from 120ms to 20ms. This makes sense too, as my model compromised of 7 Embeddings, 10 GRUs, & 6 Dense layers. So it was very RNN heavy & benefitted a lot from the computations taking place on the CPU only.
Using CPU also made sense for me because at 20ms, I could do 50 batches/sec with a batch size 16 = 800 requests/sec which was more than enough for my requirements & a 32-core CPU instance cost half as much as the cheapest GPU instance.