profiler
 profiler copied to clipboard
Difficulty in understanding the profiler's graph
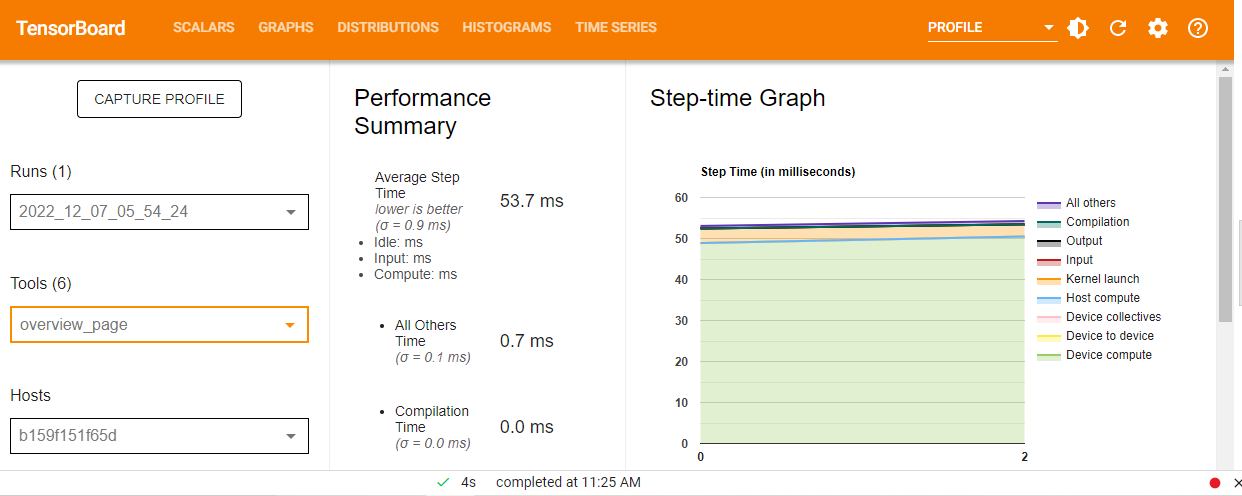
Hi all, I am trying to profile the following code , I am facing issues understanding the graphs of the profiler. 1)In the Step time graph what does the "σ " stand for ? 2)why is the x axis showing 0-2 when I have tried to profile batch 300-301, same with trace viewer . (i see a open ticket stating wrong x axis of the graph , is it resolved or still has issues?) 3)What does a step mean here? is it one batch i.e one forward pass and a backpropagation? 4)Is there any way I can calculate the gflop output during its execution ?
from keras.applications.resnet import ResNet50 from keras.datasets import cifar10 import tensorflow as tf import datetime
(x_train, y_train), (x_test, y_test) = cifar10.load_data() x_train, x_test = x_train / 255, x_test / 255 # normalize data
model = ResNet50(input_shape=x_train.shape[1:], weights=None) model.compile( optimizer = 'adam', loss = 'sparse_categorical_crossentropy', metrics = ['accuracy'])
log_dir = 'sowmya' + datetime.datetime.now().strftime('%Y%m%d-%H%M%S') tensorboard_callback = tf.keras.callbacks.TensorBoard(log_dir=log_dir, histogram_freq=1 ,profile_batch='300,301')
model.fit( x = x_train, y = y_train, epochs = 2, batch_size=128, validation_data = (x_test, y_test), callbacks = [tensorboard_callback] )
Hi Sowmya,
- "σ " stands for standard deviation for this metric (since the displayed value is an average)
- the x axis is an indexed series from 0, the graph basically shows you have 3 steps for your captured profile
- A "step" is a group of computations defined in a combination of "heuristic" and "user customized" logic. (eg. for tensorflow custom logic: https://www.tensorflow.org/guide/profiler#profiling_custom_training_loops). However for keras, as far as I know, it has its own self-annotated steps as "train" and "test" step. You may double check on this by going to the "trace viewer" tool and looking at the Step row.
- sorry there's not current way I'm aware we can do this
# First, build the profiler options
opts = (tf.profiler.ProfileOptionBuilder(tf.profiler.ProfileOptionBuilder.time_and_memory())
        .with_step(-1)  # profile the last step
        .with_accelerator_memory_usage(True)
        .with_node_name_regex('.*')  # profile all nodes
        .build())

# Next, create a session and run the model
with tf.Session() as sess:
  # ... set up the model and data ...
  sess.run(tf.global_variables_initializer())
  sess.run(tf.local_variables_initializer())

  # Run the model and profile it
  run_metadata = tf.RunMetadata()
  sess.run(model, options=tf.RunOptions(trace_level=tf.RunOptions.FULL_TRACE),
           run_metadata=run_metadata)

  # Extract the GFLOPS and other performance metrics
  flops = tf.profiler.profile(sess.graph, run_metadata=run_metadata, cmd='scope', options=opts)
  print('GFLOPS:', flops.total_float_ops / 1e9)
You can then view the results in TensorBoard by navigating to the "Profile" tab and selecting the "Flops" metric. Note that this approach will only work if your model has been built with support for automatic differentiation, as this is required to compute the gradients needed to update the model's parameters.
I'm new to tensorflow, can u please help me out with the code to profile ResNet50 on CIFAR10 and also calculate the gflops during its execution. Please id be very grateful .