Counting ops in sympy is slow
When profiling the following code:
python code being profiled
from symforce import geo
from symforce import sympy as sm
from symforce import typing as T
from symforce.opt.factor import Factor
from symforce.opt.optimizer import Optimizer
from symforce.values import Values

def test_rotation_smoothing() -> None:
    num_samples = 1000
    xs = [f"x{i}" for i in range(num_samples)]

    factors = []

    ### Prior factors

    for i in range(num_samples):
        x_prior = geo.Rot3.from_yaw_pitch_roll(roll=0.1 * i)

        def prior_residual(x: geo.Rot3, epsilon: T.Scalar) -> geo.V3:
            return geo.V3(x.local_coordinates(x_prior, epsilon=epsilon))

        factors.append(Factor(keys=[xs[i], "epsilon"], name="prior", residual=prior_residual,))

    # Create the optimizer
    optimizer = Optimizer(factors=factors, optimized_keys=xs)

    # Create initial values
    initial_values = Values(epsilon=sm.default_epsilon)
    for i in range(num_samples):
        initial_values[xs[i]] = geo.Rot3.from_yaw_pitch_roll(yaw=0.0, pitch=0.1 * i, roll=0.0)

    result = optimizer.optimize(initial_values)


test_rotation_smoothing()
Note, cProfile is used to perform the profile, and snakeviz is used to visualize the profile.
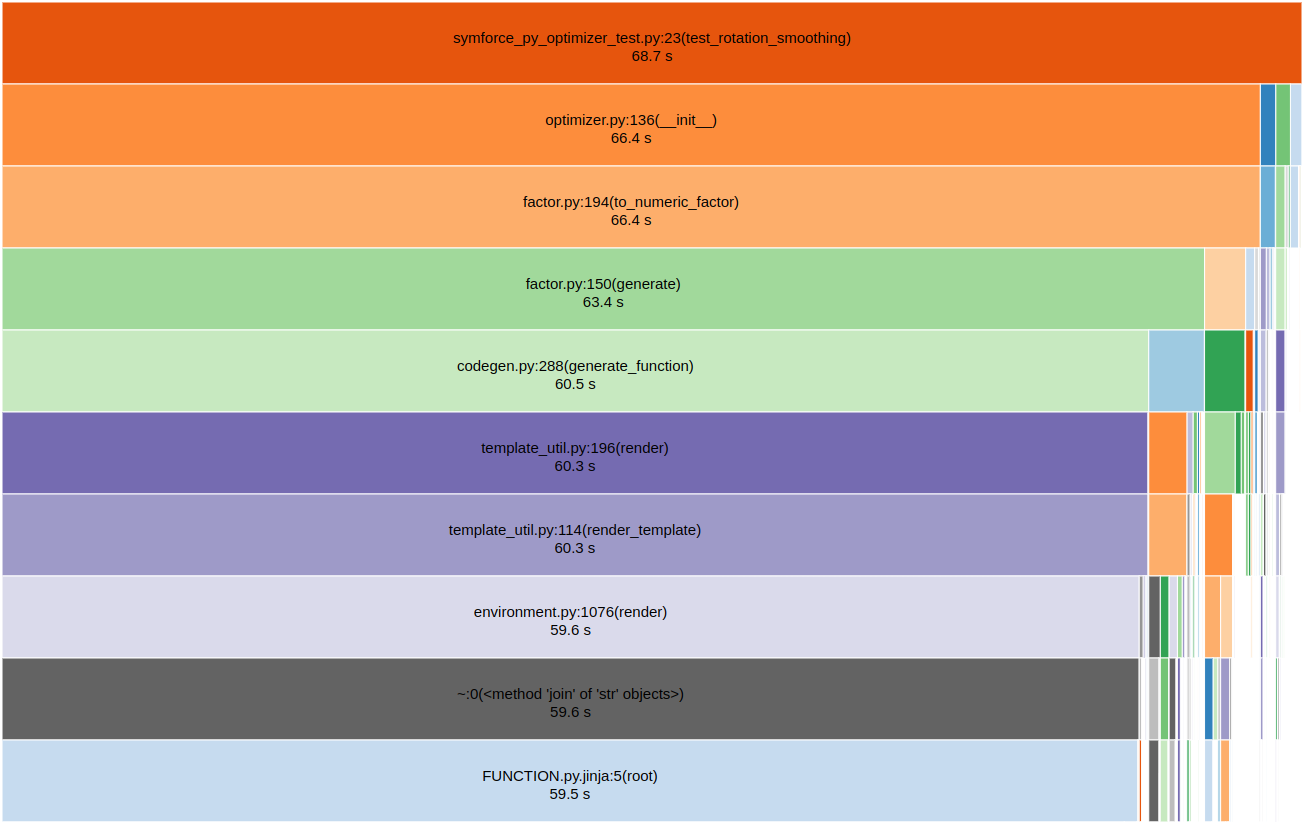
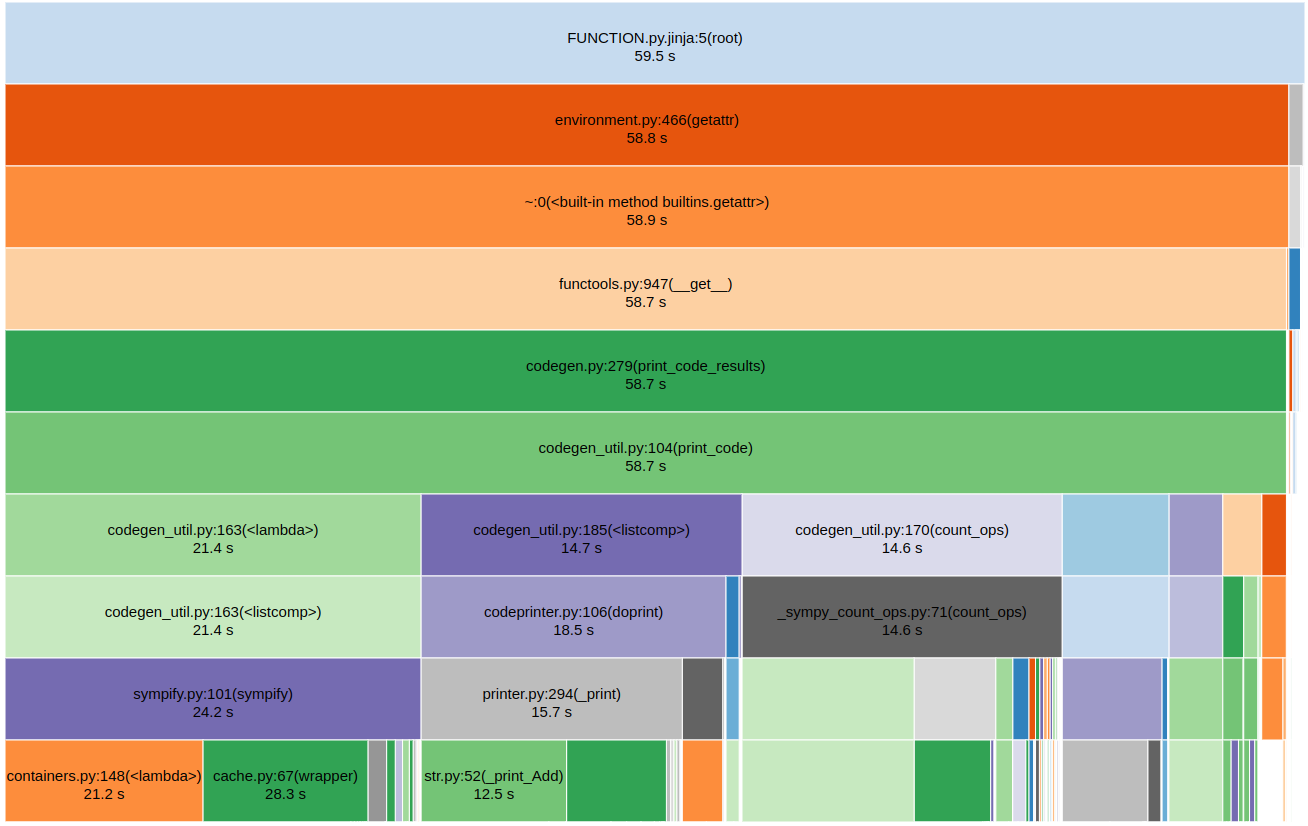
We see that 21% of the time is spent counting ops. (14.6 / 68.7 = 0.213). Specifically, the offending code in codegen_util.py is
    temps_formatted = simpify_list(temps_formatted)
    dense_outputs_formatted = simpify_nested_lists(dense_outputs_formatted)
    sparse_outputs_formatted = simpify_nested_lists(sparse_outputs_formatted)

    def count_ops(expr: sm.Expr) -> int:
        op_count = _sympy_count_ops.count_ops(expr)
        assert isinstance(op_count, int)
        return op_count

    total_ops = (
        count_ops(temps_formatted)
        + count_ops(dense_outputs_formatted)
        + count_ops(sparse_outputs_formatted)
    )
Note, while this uses our custom _sympy_count_ops.count_ops instead of sympy.count_ops, they are almost the same exact function, and have the same execution time.
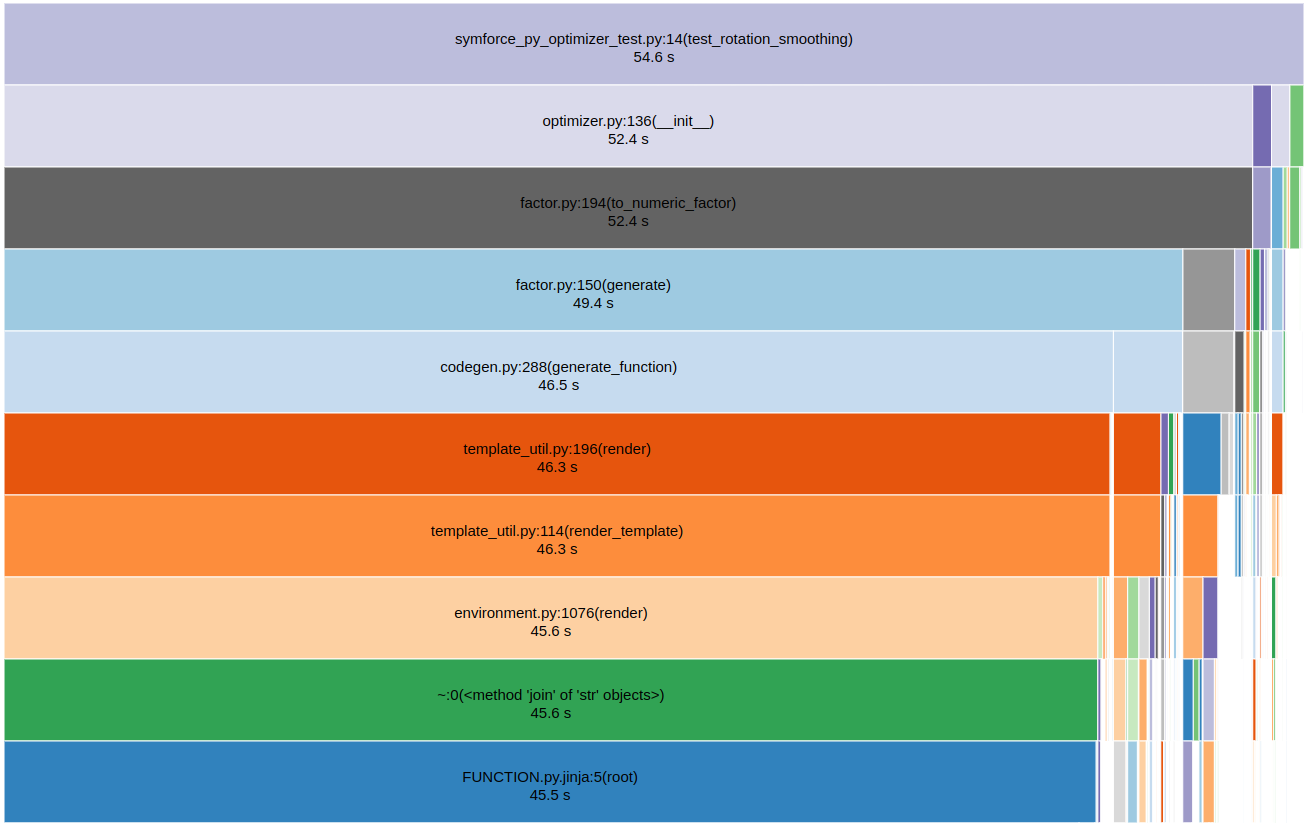
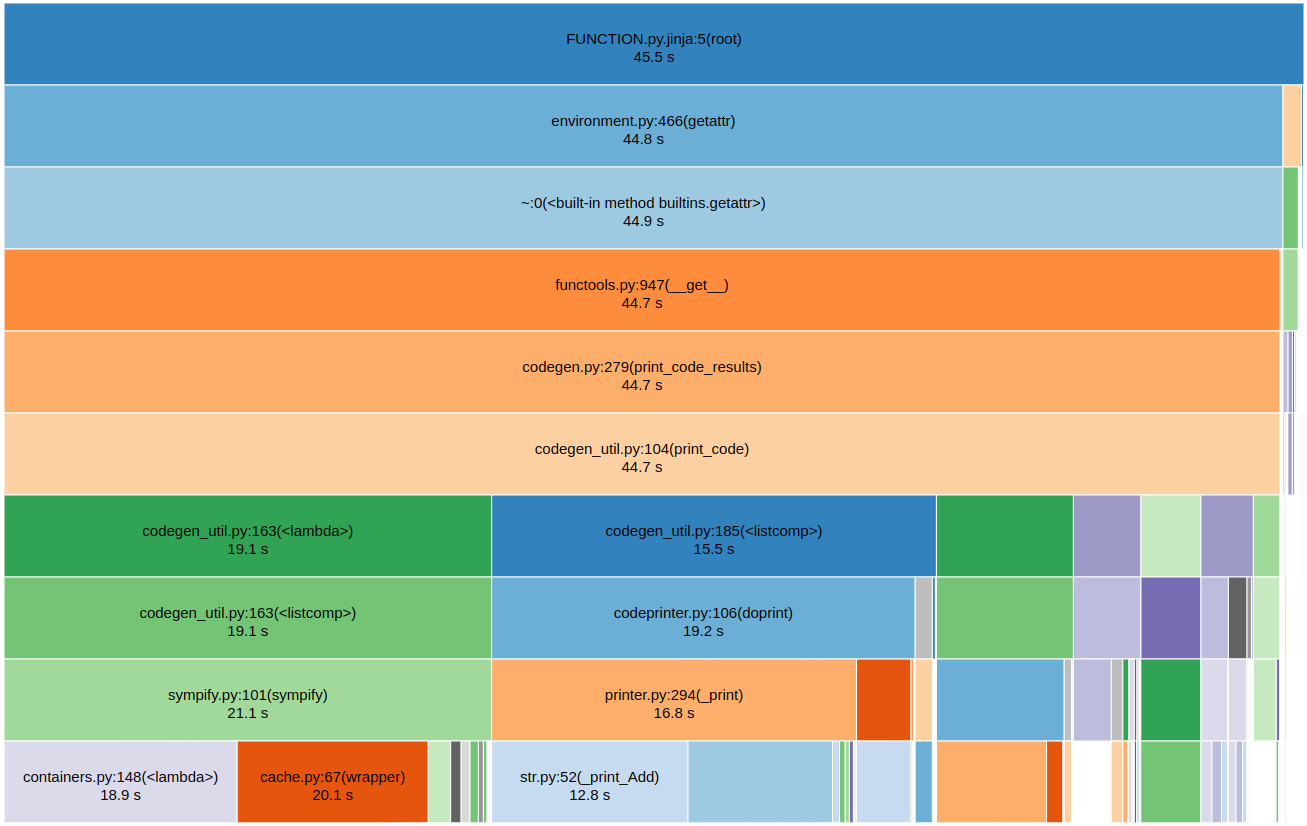
If instead we simply call symengine.count_ops here instead, the profile speeds up by roughly 20%.
Note, however, that this gives us a different op count (only slightly different).
The point being that sympy's count_ops is slow, and we could speed up codegen time using a python extension module (whether by modifying symengine or having something separate).
Additionally, given that a similar amount of time is spent in printer.doprint, a similar speed up could be achieved to enable direct printing of symengine expressions (rather than having a conversion to sympy first).
Noting that the 20% is on the total time right, and symengine.count_ops takes effectively zero time?
Are the differences in op counts the same as we get from flipping eval_on_sympy (https://github.com/symforce-org/symforce/commit/d094cdad2de3b89dcaff94f8fa882bf99e77b488), or are there additional differences? I was thinking we got things to basically the same op count for the same expression tree and the differences were simplifications on conversion. Which would also mean that it isn't as simple as doing the op counts on symengine expression trees