stdlib
 stdlib copied to clipboard
feat: add datasets/penguins
Closes: #300
Description
What is the purpose of this pull request?
This pull request:
- Implements the RFC proposal for adding the penguin dataset as an alternative to the iris dataset.
Related Issues
Does this pull request have any related issues?
This pull request:
- closes #300
Questions
Any questions for reviewers of this pull request?
Unsure about the licensing related information for this dataset, I had simply cloned these details from pace-boston-house-prices dataset with minor modifications. Might need some extra eyes reviewing the LICENSE & README.md's LICENSE section. Also wanted to know if needed to get in touch with the dataset authors for permissions?
Other
Any other information relevant to this pull request? This may include screenshots, references, and/or implementation notes.
Data was cloned from this repo URL and the column names were altered to follow camel Case conventions. No other changes were made to the data.
Checklist
Please ensure the following tasks are completed before submitting this pull request.
- [x] Read, understood, and followed the contributing guidelines.
@stdlib-js/reviewers
@Planeshifter - thanks for the review! I have made all the suggested changes.
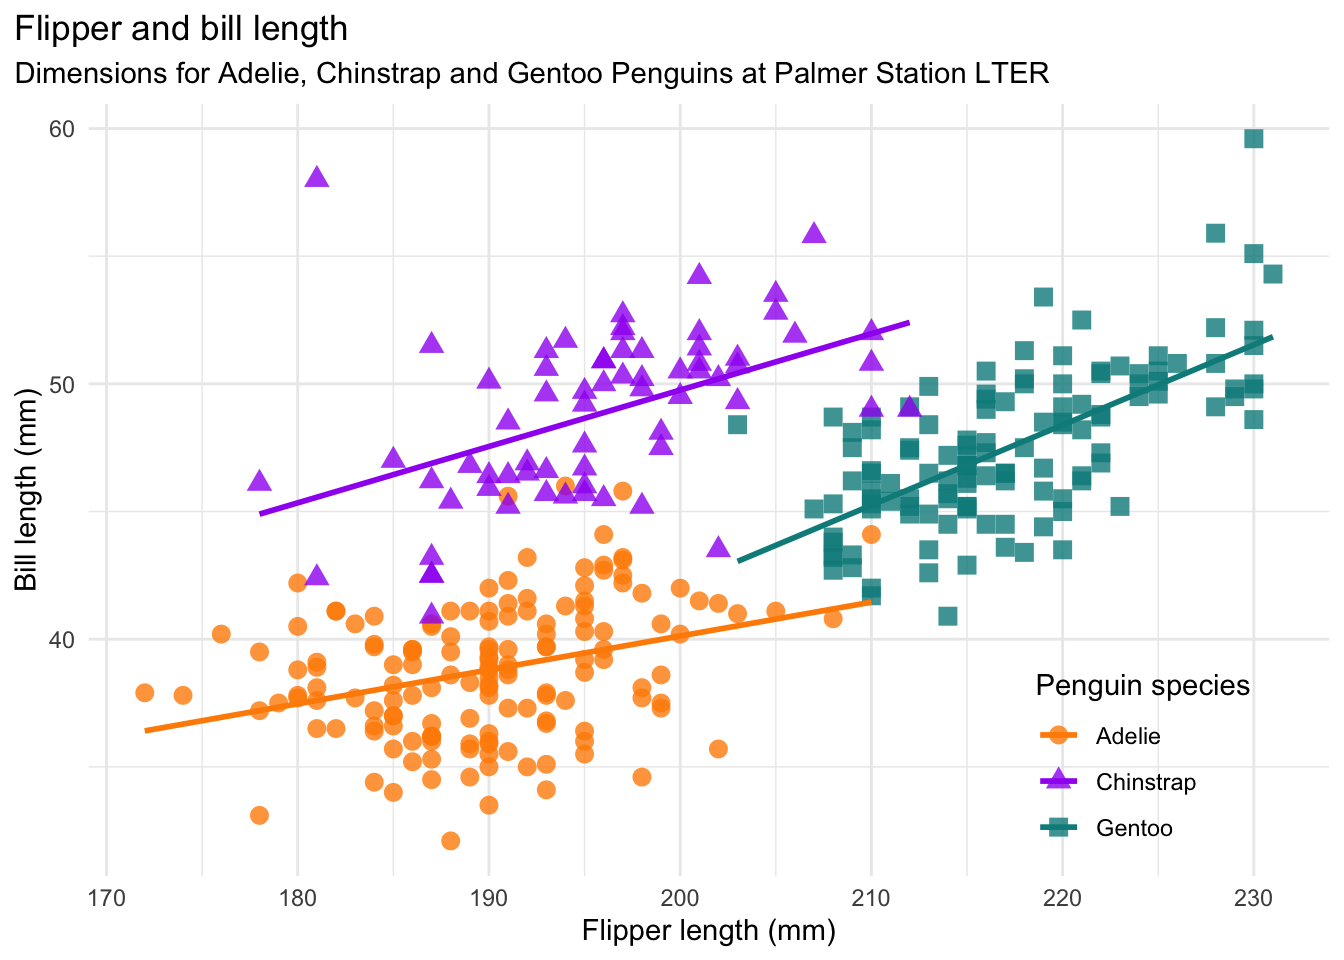
As an add on, I had tried to create a scatter plot visualizing the different species with Flipper Length vs Body Mass in the examples/index.html with this code, but I was not able to get the labels to show up. Could you please let me know if we have some inbuilt parameters that we could use for this? Also I am only seeing the same color for all label instances.
Code:
// Extract Penguins data...
x = [];
y = [];
species = [];
for ( i = 0; i < data.length; i++ ) {
	flipperLen = data[ i ].flipperLength;
	bodyMass = data[ i ].bodyMass;
	speciesType = data[ i ].species;
	if ( flipperLen !== null && bodyMass !== null && speciesType !== null ) {
		x.push( flipperLen );
		y.push( bodyMass );
		species.push( speciesMapping[ speciesType ] );
	}
}

// Create a plot instance:
opts = {
	'lineStyle': 'none',
	'symbols': 'closed-circle',
	'xLabel': 'Flipper Length (mm)',
	'yLabel': 'Body Mass (g)',
	'title': 'Flipper Length & Body Mass for Adelie, Chinstrap & Gentoo Penguins'
};
plot = new Plot( [ x ], [ y ], opts );

plot.width = 650;
plot.height = 480;
plot.colors = 'category20';
plot.labels = species;

// Render the plot:
console.log( plot.render( 'html' ) );
Output of the above code:
What I am hoping to achieve (minus the best fit line):

@Infinage No need to add an examples/index.html file. If we were to generate a plot, we'd do so by opening an Electron window.
Got you, so do I need to have this file removed?