socplot
 socplot copied to clipboard
Python package that helps you visualize football data :soccer:
Socplot
Socplot is a python 3 package that helps you visualize football data. [WIP]
Why Socplot?
- Made by football enthusiast.
- Fully configurable in terms of dimensions, colors and types.
- Lightweight and Flexibility: Socplot is built on top of matplotlib. You have full control.
- Straightforward: Socplot has many built in figures that gets you directly to the point.
Gallery
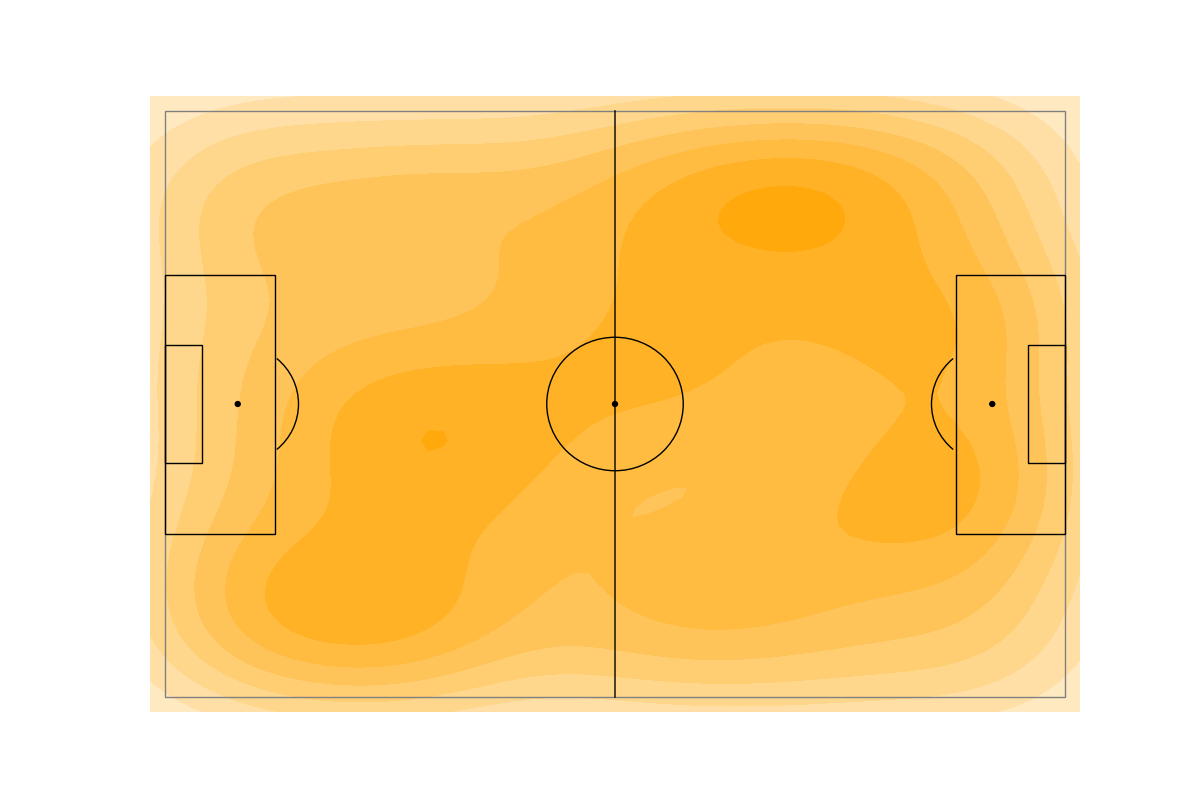
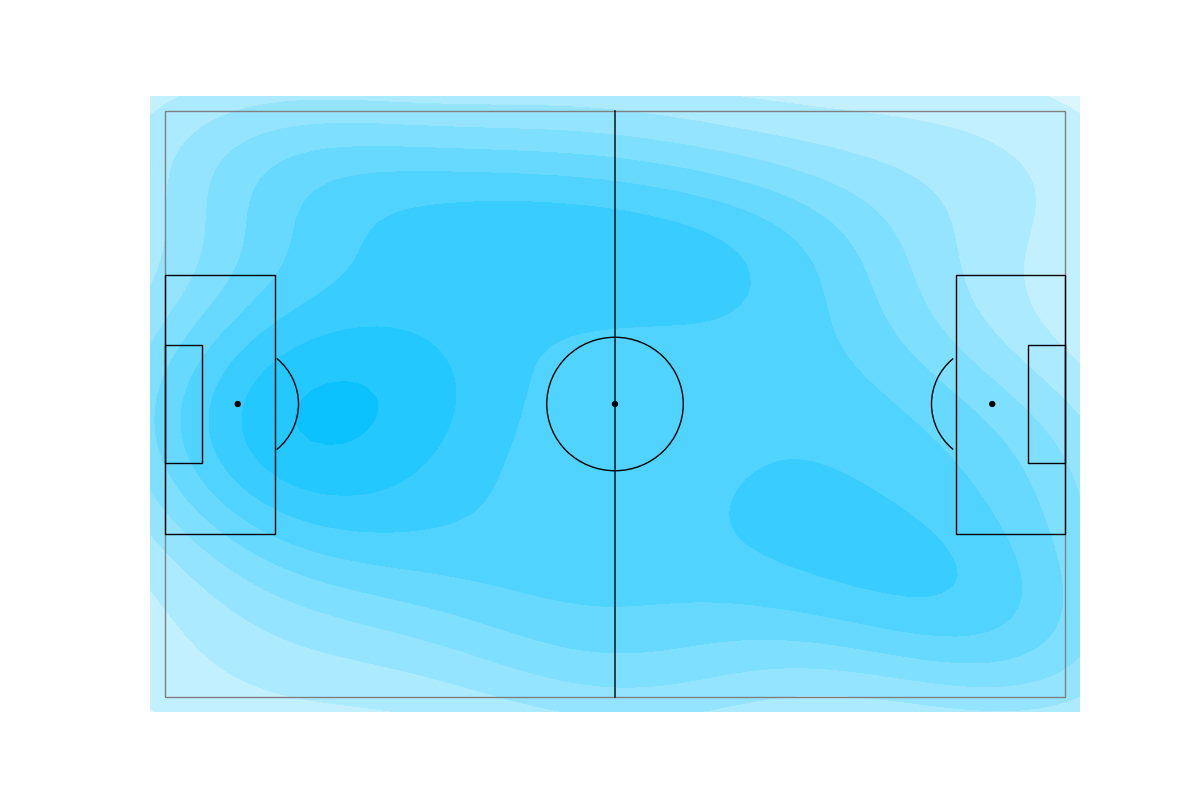
Pressure heat map
pressures position heat map for an example match
Pass map
pass map for selected time window in an example match

first 15 mins passes in an example match

Example
code snippet used to generate the last image
import pandas as pd
from socplot.pitch import Pitch

pitch = Pitch()

# load the passes dataset

for _, row in passes.iterrows():
   pitch.plot_pass(row['sx'], row['sy']],[row['ex'], row['ey']] , row['type'])

pitch.heat_map(df['sx'], df['sx'], color='tan')
__
Installation
pip installtion coming soon
Dev Installation
# fork the repo
cd socplot
virtualenv -p python3 env
source env/bin/activate
pip install -r requirements.txt
LICENCE
ArqamFc/Socplot licensed under the Apache License 2.0.