rstanarm
 rstanarm copied to clipboard
stan_surv — Rearranging the data produces different results
Summary:
stan_surv produces different results after rearranging (sorting) the observations despite using the same seed.
Description:
As per the summary. With the example data below, this issue happens with basehaz = "weibull" or basehaz = "bs", but not with basehaz = "exp" or basehaz = "weibull-aft".
Reproducible example:
library(survival)
library(rstanarm)

data(mgus)

surv <- stan_surv(Surv(futime, death) ~ mspike,
                  data = mgus,
                  basehaz = "weibull",
                  chains = 1,
                  seed = 1234)


mgus_order <- mgus[order(mgus$mspike), ]
surv_order <- stan_surv(Surv(futime, death) ~ mspike,
                        data = mgus_order,
                        basehaz = "weibull",
                        chains = 1,
                        seed = 1234)

all.equal(as.matrix(surv), as.matrix(surv_order))

summary(surv, digits = 5)
summary(surv_order, digits = 5)
Relevant output from the last two summary functions
Estimates:
                mean      sd        10%       50%       90%
(Intercept)   -10.16572   0.64438 -10.98888 -10.15258  -9.35997
mspike         -0.11383   0.16630  -0.33068  -0.12206   0.09692
weibull-shape   1.19092   0.06669   1.10818   1.18821   1.27728

Estimates:
                mean      sd        10%       50%       90%
(Intercept)   -10.16413   0.69352 -11.03953 -10.13223  -9.30872
mspike         -0.11555   0.16577  -0.32517  -0.12085   0.11076
weibull-shape   1.19101   0.07182   1.09859   1.19006   1.28189
RStanARM Version:
2.21.2
R Version:
3.6.3
Operating System:
macOS 10.14.6
Hi @anddis - thanks for reporting this! It is a little odd. Not sure when someone will have time to look into the details of this, but I will tag it so that it can be added to the list of minor stan_surv bugs that need to be delved into.
Thanks @sambrilleman!
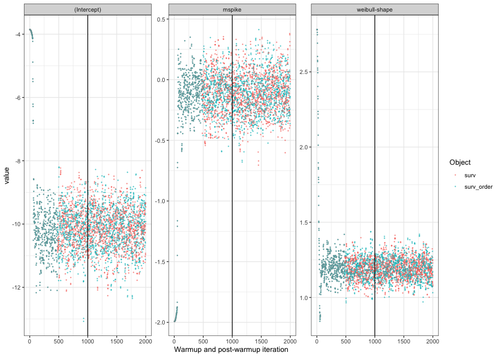
Not sure if this is helpful information to understand what's going on (probably not), but these are the posterior draws for the two models in the toy example above (1000 warm-up and 1000 post–warm-up draws).
@sambrilleman, looking at this, I feel this is a rather concerning bug, don’t you think? With more and more applications of ’stan_surv‘, I’d like to ensure this is not a manifestation of a bigger problem. if you provide me with some broad hint(s), what could cause this, I’m happy to dive into this and try to solve it.
Best, Eren.
Hi both - sorry for the really slow reply.
@ermeel86 - I don't know off the top of my head, and I've had a poke around in the code and nothing stands out. Some ideas to try out though:
- start by writing a unit test to check/confirm the behaviour for each baseline hazard (e.g. initial fit, not reordering, and reordering, each with a common seed) - I'd suggest just using a tiny dataset (e.g. 20 rows of data or something) which might also help with debugging as needed
- the unit test should confirm for us that the seed is getting passed through - i.e. not reordering the data and refitting the model produces the same results
- the unit test should confirm for us which baseline hazards are problematic
- possibly be worth checking that passing initial values (perhaps initialised at zero) doesn't change things, not sure it is relevant but might be worth double checking
I think the biggest crumbs to follow here might be that weibull and weibull-aft apparently show different behaviour. I can't remember the exact parameterisations there off the top of my head (without re-reading the docs), but I think for the most part they would have similar data structures being passed to stan. So we could check what the data being passed to stan looks like for those two baseline hazards. Relevant points in the code (e.g. to add breakpoints and inspect) might be:
- the start or end of this function which creates some data for the basehaz
- inspecting this list with the data passed to stan - in theory this should be reordered but otherwise identical I think. The only bit I see that is conditional on the aft is this, but maybe I'm wrong.
I guess perhaps with a bit of inspection we could identify whether the data being passed through to stan is reordered but otherwise as expected. If it isn't the data, then I guess we'd have to look at the actual details of the stan model, but I think checking the input data would be the best place to start... if you have time...!
Not sure if this is helpful information to understand what's going on (probably not)
I think it is helpful! I'm asking myself why the (approximately) first 500 draws do not show any visible difference on the trace-plots? But after 500 draws they differ?
Doesn't this suggest, that this is likely a bug in the Stan code (or post-processing) rather than a bug in the preprocessing (in the way input data is prepared), @sambrilleman? I find it hard to see how the chains would essentially lead to the same draws for the first 500 iterations, when the input data differs, as prepared by the R code in stan_surv.
If I find time today, I'll check the actual numerical values of those draws. Maybe this is only a graphical "illusion".
If I find time today, I'll check the actual numerical values of those draws. Maybe this is only a graphical "illusion".
@anddis, could you kindly share code to produce the trace plots above? Somewhat embarrassingly, I'm not able to access the warmup samples from a rstanarm object, nor from the internal stanfit attribute. I've tried to use rstan::extract with inc_warmup=TRUE applied to the corresponding$stanfit attributes, but it only returns post-warmup samples...
Hello @ermeel86.
Sure. I amended stan_surv's code to force the argument save_warmup = TRUE in rstan::sampling (I opened an issue about this more than one year ago here: https://github.com/stan-dev/rstanarm/issues/575#issue-1402878032 — so, nothing to embarrassed about).
The edited stan_surv function is available here: https://gist.github.com/anddis/efe72216388db850e942ec71cdc6e3d4 — See line 741 for my bush fix.
Below is the code to produce the trace plots.
Thank you for taking the time to look into this.
library(survival)
library(rstanarm)
library(tidyverse)
library(rstan)

surv <- stan_surv(Surv(futime, death) ~ mspike,
                  data = mgus,
                  basehaz = "weibull",
                  chains = 1,
                  seed = 1234)


mgus_order <- mgus[order(mgus$mspike), ]
surv_order <- stan_surv(Surv(futime, death) ~ mspike,
                        data = mgus_order,
                        basehaz = "weibull",
                        chains = 1,
                        seed = 1234)

all.equal(as.matrix(surv), as.matrix(surv_order))

cbind(drop(extract(surv$stanfit, inc_warmup = TRUE, permute = FALSE)) %>%  as.data.frame() %>% rename_all(., ~ paste0(.x, "#surv")),
      drop(extract(surv_order$stanfit, inc_warmup = TRUE, permute = FALSE)) %>% as.data.frame() %>% rename_all(., ~ paste0(.x, "#surv_order"))) %>%
  mutate(i = row_number()) %>%
  pivot_longer(cols = -c("i"), names_sep = "#", names_to = c("a", "b")) %>%
  filter(a != "log-posterior") %>%
  ggplot(aes(x = i, y = value, color = b)) +
  geom_point(size = 0.3, alpha = 0.5) +
  theme_bw() +
  facet_wrap(~ a, scales = "free") +
  geom_vline(xintercept = 1000) +
  labs(color = "Object", x = "Warmup and post-warmup iteration")

# TRUE
all.equal(drop(extract(surv$stanfit, inc_warmup = TRUE, permute = FALSE))[1:200, -4],
          drop(extract(surv_order$stanfit, inc_warmup = TRUE, permute = FALSE))[1:200, -4])

# NOT TRUE
all.equal(drop(extract(surv$stanfit, inc_warmup = TRUE, permute = FALSE))[1:400, -4],
          drop(extract(surv_order$stanfit, inc_warmup = TRUE, permute = FALSE))[1:400, -4])