Feature Idea: Code Minings for Profiling
It would be really great to have functionality like the following:
- In STS4 activate profiling on methods you would like to profile, e.g. via context menu or any other option. (This should then trigger some AOP proxy magic in the background to decorate these methods with stopwatches)
- Start the app (and perform the action you like) or run the unit test.
- Get code mining annotations on the previously mentioned methods that state (live) the count of how many times that method has been called and, most important, the duration time of that method. (in case of more than one invocation some statistics min, max, avg, median accordingly)
Is this even possible? Maybe through a combination of IDE support and DevTools?
Sounds like a really nice combination of profiling information and code minings, the idea goes way beyond a usage in Spring, I think. Makes me think whether profiling tools and their IDE integration should provide that as part of their profiling tools. Did you check whether some of the existing profiling tools for Java do something like this? Or maybe have plans to do something like this?
I can vaguely see a way to implement this in a Spring-specific way for sure, so if the profiling tools are not up for that, I could imagine something like this.
Well, usually I would manually edit the source code to wrap the sections of interest with stopwatches and then check the logs. However, this is cumbersome and unproductive. The idea came into my mind while reading this (rather old) tutorial: https://www.journaldev.com/7801/spring-aop-method-profiling
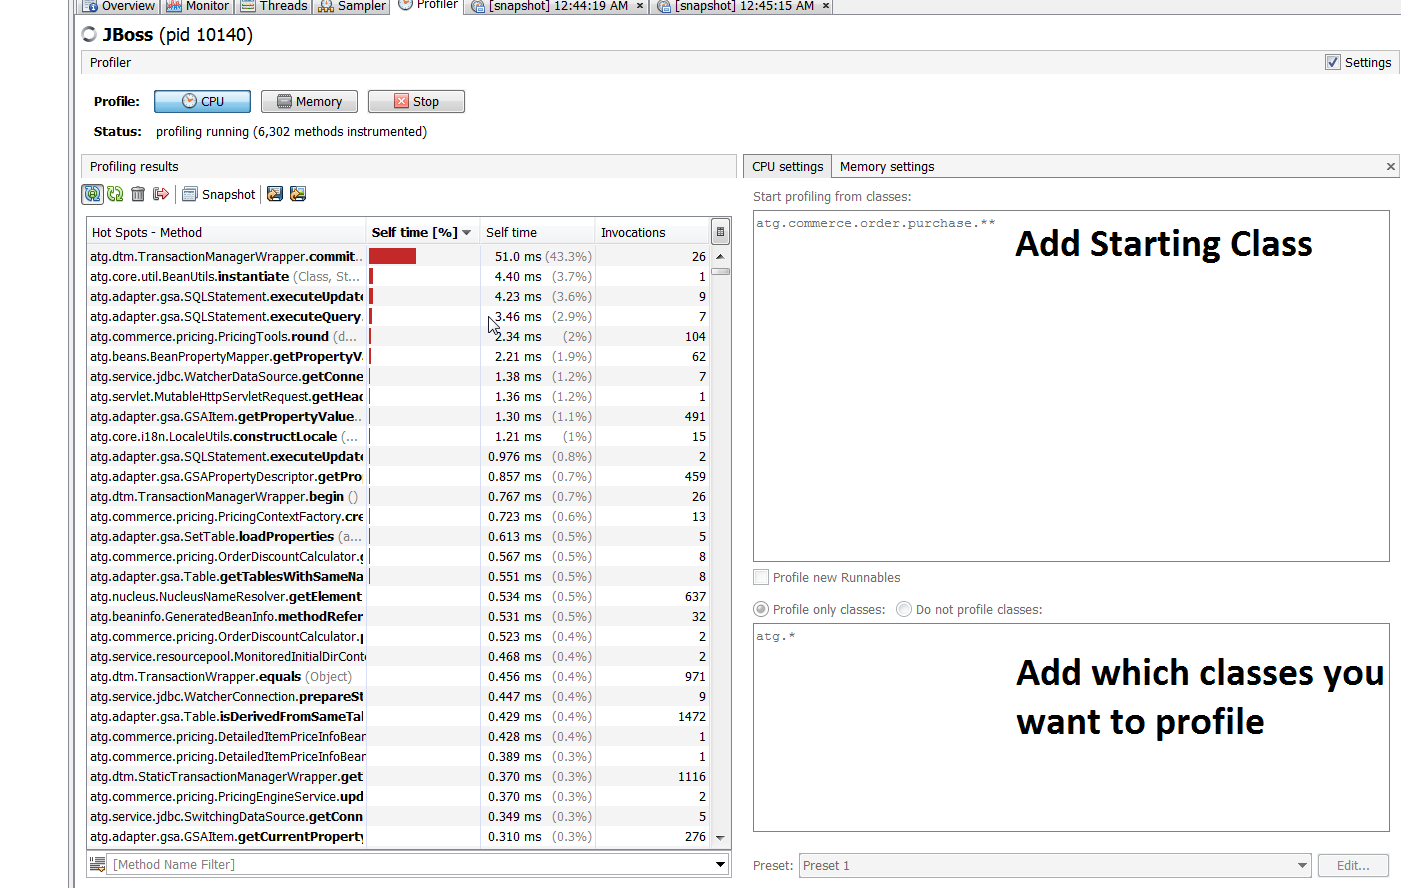
Profiling tools like for instance VisualVM allow for instrumenting method invocations quite easy, however, AFAIK there is no deep integration into an IDE like Eclipse that supports the fine-grained scenario I outlined above. They solve a more exploratory use-case (see the screenshot of VisualVM) than the more explanatory/confirmatory I have in mind.
I never tried JDK Mission Control, but it seems to have similar functionality.
So basically this feature would improve productivity by automating manual tasks (byte code modifications without really modifying the to-be-committed sourcecode) rather than competing with full-fledged profiling tools.
(comment in Pivotal Tracker added by Nieraj Singh:)
I'll be working on this with Alex (or maybe even taking over). I am just posting this as a reference:
Use /actuator/metrics endpoint from the running Spring Boot app to fetch various metrics data and display numbers in the UI in Eclipse/VSCode. Micrometer is part of the Actuator since Spring Boot 2.0 hence the trigger to make Live Metrics data available is the same as for Request Mappings, Beans, Environment. (Also available via JMX bean if more convenient)
Thoughts: Early investigation indicates that metrics cannot be obtained all at the same time as opposed to beans for example. Seems that /actuator/metrics endpoint only allows to query one specific metric. For example to get the count and time for a specific endpoint one would execute HTTP GET with URL: http://localhost:8080/actuator/metrics/http.server.requests?tag=uri:/owners/new&tag=method:GET (Petclinic example). UI representation of the metrics data is currently thought to be CodeLens over the RequestMapping declaration in the code. This can be achieved by getting metrics data for the Request Mappings in the currently opened editor with a 30s period It might also be embedded into the Request Mapping annotation hover and would align better with the backend supplying the metrics data.
(the previously posted link here was not meant to be used in public and therefore got deleted)
It looks like Digma had a similar idea to profile (using OTel) and add Code Minings directly in the editor. Looks good https://www.youtube.com/watch?v=QP8RqYLbIbs