spectral
 spectral copied to clipboard
Showing wavelengths
Hi folks
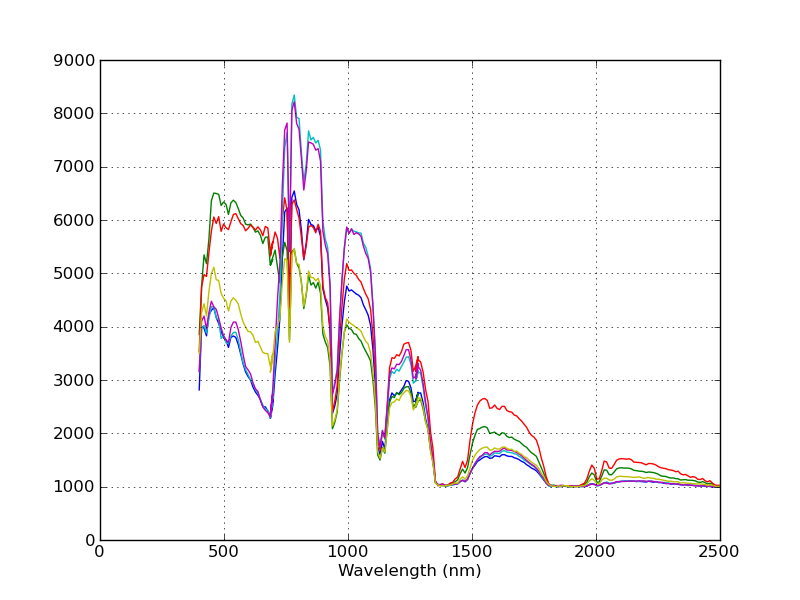
Just gotten started in SPy and getting to know the functionality. Because of my equipment I've been reading data into SPy as a .mat file, and indexing the MxNxC array within it as my image object. It's been working well so far, but for the spectral charts when creating imshow I'd really like to to be able to see the wavelengths along the X axis when I click on the pixel, a lot like the functionality for Aviris file types.

I see a slightly different issue was raised last year for the same object, being the ImageViewMouseHandler. just wondering what do to get the behaviour as above. I'm reading the source, so the second plot graph curves across the spectrum is coming up fine, but I'm unsure of what approach to take to get the associated wavelengths along the X axis. I'm pretty new to Python and even Hyperspectral data, so not sure what I should be doing here. Thanks in advance
I'm not immediately aware of a solution that is both clean/elegant and simple, particularly if you are new to both python (and Spectral Python) and hyperspectral imaging.
One solution would is to create your own subclass of ImageArray (e.g., NumpyImage) and overload the __new__ and __init__ methods to take a numpy array and metadata dict as inputs. That's probably the cleanest, most efficient long-term solution but it requires a bit more knowledge and python coding skills.
If you want something working quickly without creating/modifying code, the easiest way is probably to just save your numpy array to ENVI format using spectral.envi.save_image and pass the band centers in the metadata argument. Then, load the ENVI-formatted image and display it.
Thanks for your response @tboggs
I'm probably selling myself short a bit with Python, I'm upto the basics of OOP and the semantics. Will definitely look at playing with ImageArray in the next few weeks as a more robust solution long term.
I actually did think about the ENVI save as a possible workaround in the meantime, but looking at envi.save_image it takes a .hdr extension as an argument? Unfortunately I'm only working with .mat files (specifically the metadata dict of that file), and don't know any particular way to get it into hdr file type. There is a MATLAB function to do it, but haven't been able to get that working.
The .hdr extension is the name of the file you are creating with the spectral.envi.save_image function. Presumably, you are loading the numpy array and band metadata from the .mat file. You would pass the new .hdr filname and numpy array to the save_image function, along with a "metadata" keyword arg, which is a dict with a "wavelength" key associated with the list of wavelengths.