Need Image Prep Phase to Standardize Image Resolution
Images that are being augmented need to be standardized to the resolution for which the augmentation is designed. Otherwise, the scale of the augmentation may not match the target image.
This issue proposes to (1) detect the current resolution and (2) change the incoming image to match the normalized standard resolution.
Detection Approaches
To detect the current resolution of any image, we could make guesses based on the size of the image. This will likely work for normal documents. However, a lot of our images that are being tested don't fit this profile.
Another approach is to scan vertically and horizontally to capture average stroke widths along with average gaps between strokes to make a probabilistic guess of the image's current resolution.
Both of these approaches can be used in tandem, and both will require testing to determine what values make the most sense.
Target Resolutions
The resolution that we should target by default should match with current OCR guidance, which is:
- 300 DPI, or
- 30 pixels for capital letters, or
- 3 pixels for stroke widths
Some augmentations may benefit from a higher DPI prior to down sampling to the target DPI needed. However, to keep this simple for now, we should avoid that extra processing step, so that everything is uniform once the images have been prepped for processing.
@kwcckw I saw you're working on #68 - could you also work on this one?
Here's @jboarman's idea for how to start:
- apply Otsu binarization
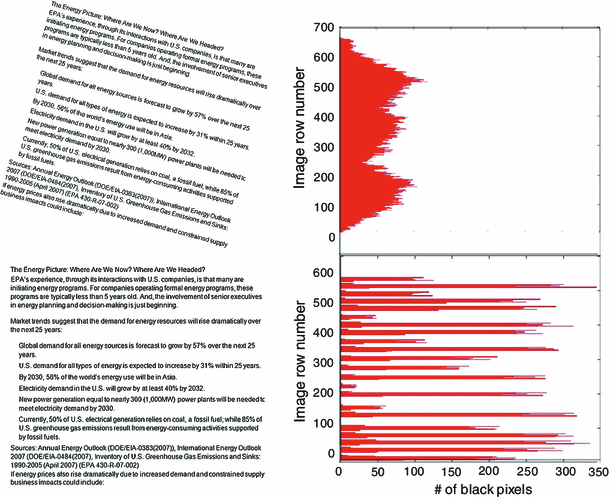
- do a horizontal scan of every line in the image, counting the length of each segment of consecutive black (1s in numpy array); increment counter within a summary array using the index to respectively represent a given length (see this run-length encoding implementation for an easy NumPy solution: https://stackoverflow.com/a/32681075/764307)
- review array counts visually via a histogram -- then, compare histograms across a number of documents of known/suspected resolutions to assess whether a predictable pattern emerges
I tried this but ran into an index out of bounds bug in the ia[i] call, and I'm really bad at thinking about arrays, so I need your help.
@kwcckw I saw you're working on #68 - could you also work on this one?
Here's @jboarman's idea for how to start:
- apply Otsu binarization
- do a horizontal scan of every line in the image, counting the length of each segment of consecutive black (1s in numpy array); increment counter within a summary array using the index to respectively represent a given length (see this run-length encoding implementation for an easy NumPy solution: https://stackoverflow.com/a/32681075/764307)
- review array counts visually via a histogram -- then, compare histograms across a number of documents of known/suspected resolutions to assess whether a predictable pattern emerges
I tried this but ran into an index out of bounds bug in the
ia[i]call, and I'm really bad at thinking about arrays, so I need your help.
Sure, i will check on the link and try it later.
I added an example here:
https://colab.research.google.com/drive/1OQ_AKllfnwd_K6R53lUICqVhKd8SjCpS?usp=sharing
The idea is to compare image1 to image2 using histogram of their black & white sequence length per line, then we generate a score, where: score<0.5 = image2 is better than image1 score>0.5 = image1 is better than image2 score=0.5 = same
Awesome! That’s interesting. Can you add a step to the notebook that shows a histogram created by counting each occurrence of the rle values? This will be important when analyzing a larger sample of documents in the event that the shape or cut off patterns may emerge.
Also, we should try connecting a zip file posted on figshare or even gdown to a shared google drive folder where we can loop through a large set of images and display them along with other metadata about the image (file size, dimension, score, histogram, etc).
Also, we should try connecting a zip file posted on figshare
Working on this
Awesome! That’s interesting. Can you add a step to the notebook that shows a histogram created by counting each occurrence of the rle values? This will be important when analyzing a larger sample of documents in the event that the shape or cut off patterns may emerge.
Yea, that is feasible, i will include that in the next update. Also i'm still thinking on a better method to compare images with different size, either we resize one of them (making the smaller image larger) or we may need extrapolate those computed values, but for now i think we can resize one of them and test first.
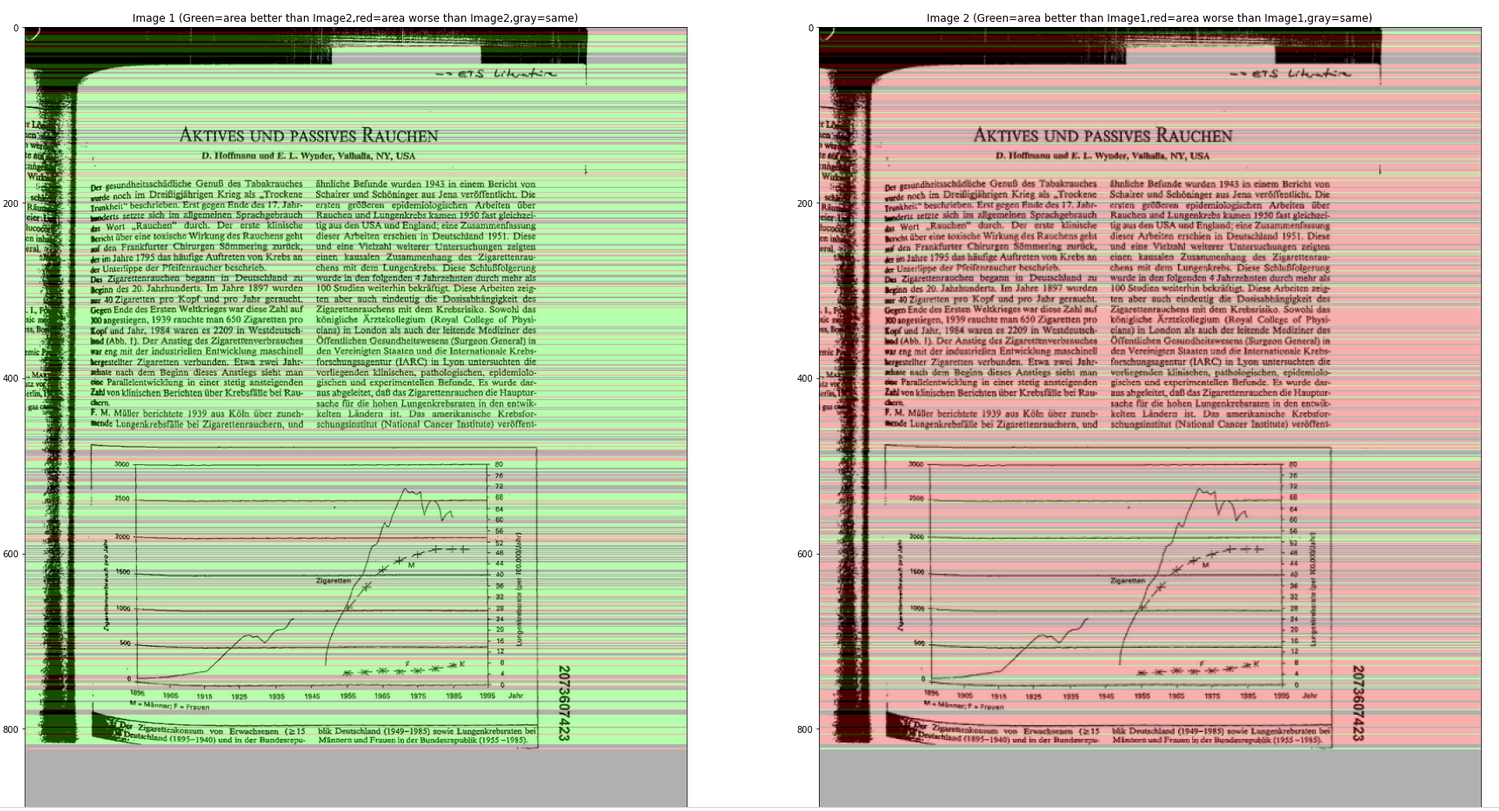
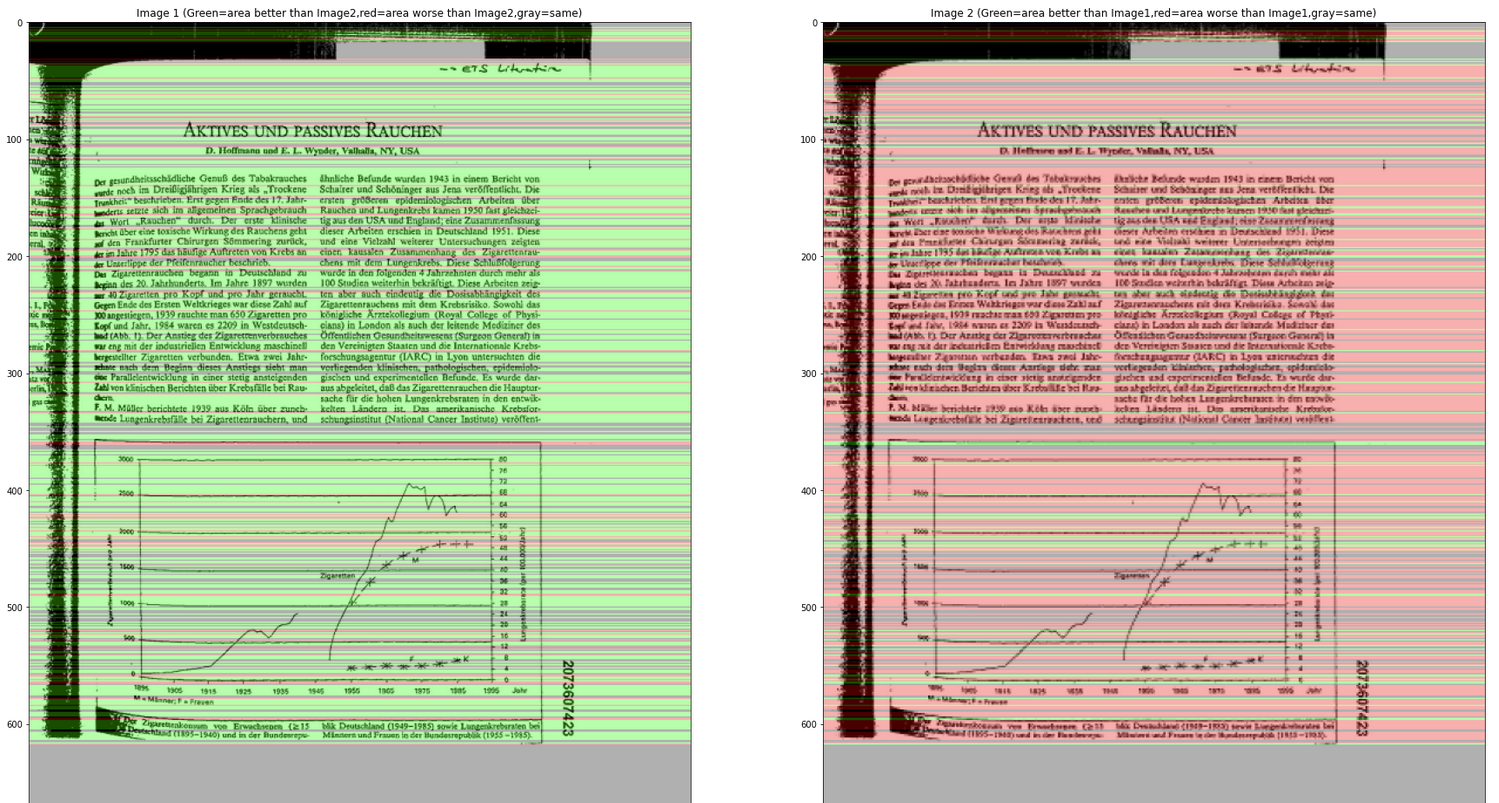
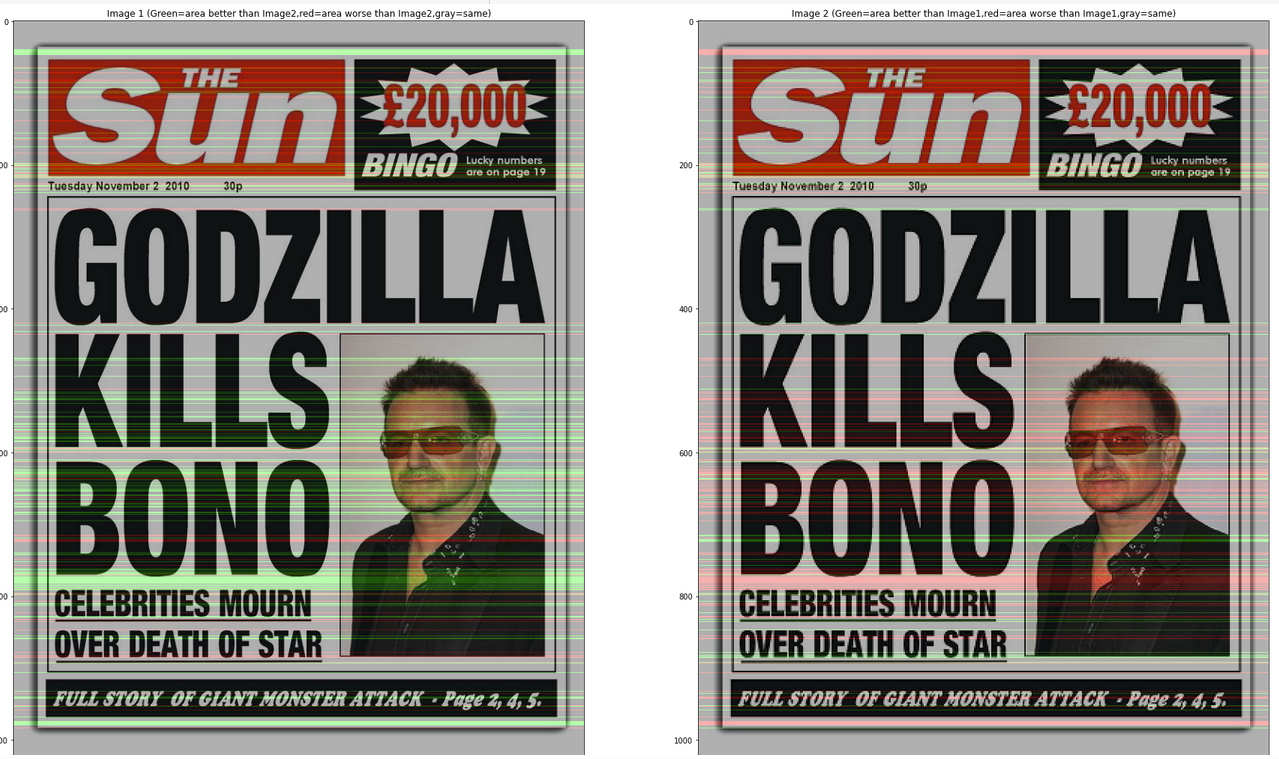
I updated the notebook, now it shows histograms and images to show comparison area, where green area = area better than the other image red area = area worse than the other image gray area = same
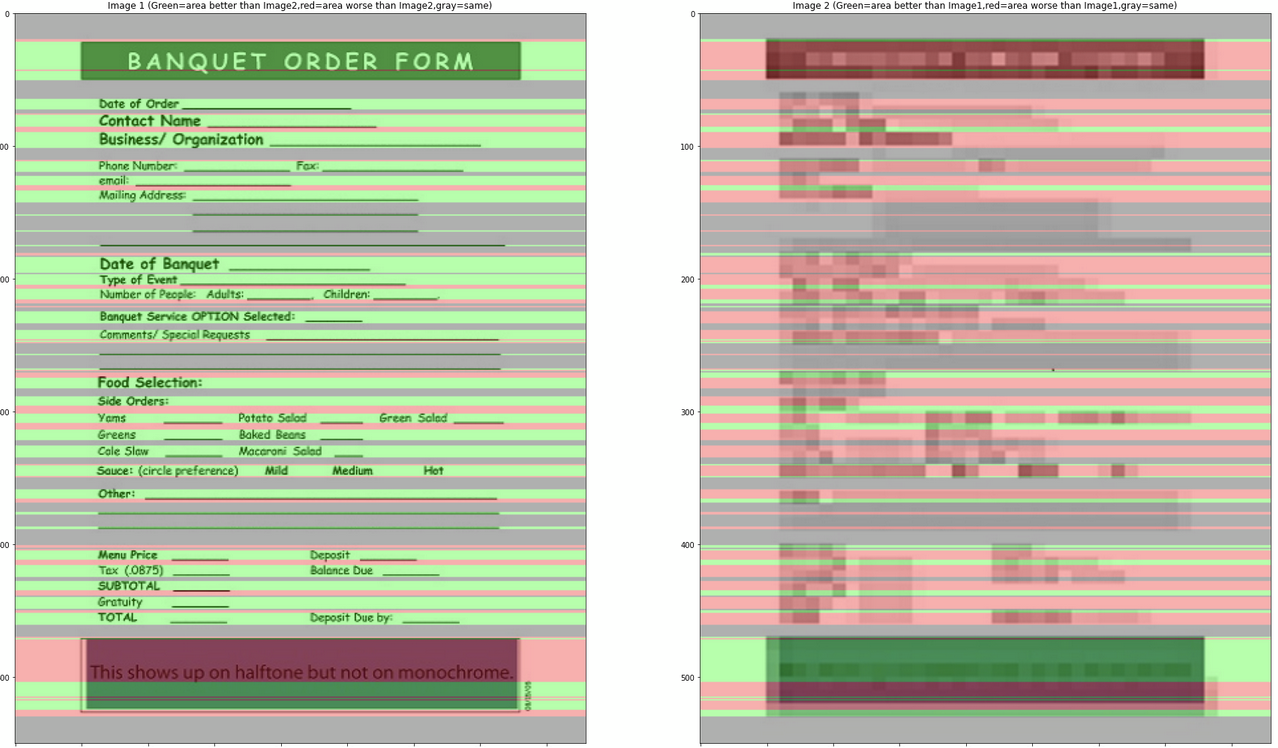
I updated the notebook, now it shows histograms and images to show comparison area
Nice work ... this looks impressive! To compare image resolutions, I think the image on the left should be the original and the image on the right should be a downsampled version of that same image. For example, instead of using the "bad" version that is downloaded, we would just resize the 1st image to 50% of the original so that we are comparing the same image at 100% and 50% sizes.
I'll be very interested to see this displayed across a number of different images from our set of random document images.
I changed the example and updated the code a bit, now it's showing result from original image and their scaled down image, so far the result looks good:
(left = original image, right = 75% scaled down), Score=0.8486312399355878
(left = 75% scaled down, right = 50% scaled down), Score=0.836864406779661
(left = original image, right = 50% scaled down), Score=0.7114427860696517
For the next step, i think we can proceed to try with some benchmark images to compare them and estimate their dpi.
Can this predict the DPI of an image?
Theoretically yes, but i haven't test until that stage yet. So given an image with known DPI, we can estimate the DPI of input image by using their score. If score= 0.5, DPI = same, while if score = 1, DPI = 2 times the known DPI. At this moment, do you have any sample image from your end with known DPI?
This should be 300DPI.
Thanks, i briefly tried it just now, it seems when the images size are varied too much, the current algorithm doesn't work so well to get a consistent estimated DPI, probably is due to i resized one of the image. At this point, do you have any suggestion on this constraint? (You may view the notebook again to see the DPI score).
Additionally, do you have another image with known DPI? So that i can compare both of them to get an estimated DPI and check with the known DPI value?
We will need to get a sample of various clean PDFs that can be printed and scanned at varying resolutions. Once we have that, then we will need to plot the values to see how well they correlate to DPI. It may turn out that a whole predictive model is needed to consider many factors for a reasonable DPI estimation.
Given that this may entail plenty of effort, we may want to defer this until we have completed other exercises needed to launch and promote V4 of Augraphy. Until then, we should probably suggest that input documents be prestandardized to a specific DPI for which augmentations are optimized.
Okay, then i think input image should be at least 300 dpi for now, that's the minimum requirement for medium resolution images.
This stackoverflow post may offer some insight into additional measures that could be used to infer dpi:
Finding strokewidth in the image https://stackoverflow.com/questions/22425545/stroke-width-transform-opencv-using-python
This stackoverflow post may offer some insight into additional measures that could be used to infer dpi:
Finding strokewidth in the image https://stackoverflow.com/questions/22425545/stroke-width-transform-opencv-using-python
Thanks, i will check again on this later.
Another similar concept to consider whenever we get back to this issue:
 https://link.springer.com/article/10.1007/s10032-014-0230-y
Stroke Width Transform (SWT)
This technique, which seems to have been originally designed to locate text in a scene or document, may have some application here if we can use a small sampling technique to apply this on a few small patches of the document. The number of samples and their size just need to be large enough to be representative.
https://github.com/sunsided/stroke-width-transform
Finding the DPI of an Image Using Basic Heuristics:
- Calculate the DPI of an Image using a lookup table
- Finding the DPI of an Image using a Pixel Matrix Algorithm
Calculate the DPI of an Image using a lookup table
We find the record in the lookup table which closely resembles the height and width of the source document (in inches) and evaluate the similarity between the data points using Euclidean Distance Metric. Height and width of the source document can be calculated using the formula
height = pixel height/ dpi width = pixel width/ dpi
Calculate the DPI of an Image using a Pixel Matrix Algorithm
Effective DPI can also be calculated using the aspect ratio of the source document.
Formula
Aspect_ ratio of source document equal to or less than aspect ratio of pixel matrix:min(height(pixels), width(pixels))/width in inchesAspect ratio of source document greater than aspect ratio of pixel matrix:: max(height(pixels), width(pixels))/height in inches
Link for Reference: http://preservationtutorial.library.cornell.edu/conversion/conversion-04.html