spacepy
 spacepy copied to clipboard
trace2d: allow extrapolation control
The pybats trace2d functions currently extrapolate for one grid point outside the given domain. This means the streamline can leave and reenter the domain in a nonphysical way.
There's a simple function in the C that decides how far out of the domain the streamline can go before reentering; it's set to the one grid point, but can be changed.
Minimal example
I apologize, this is terrible
import datetime

import matplotlib.colors
import matplotlib.pyplot
import numpy
import spacepy.coordinates
import spacepy.irbempy
import spacepy.pybats
import spacepy.pybats.trace2d
import spacepy.time

# Coordinates in GSE expressed as an XZ grid (will assume Y=0, noon-midnight plane)
x = numpy.arange(-15, 10.1, 0.1)
z = numpy.arange(-8, 8.1, 0.1)
# Repeat so that every X component is repeated across every Z, and throw in Y=0
_ = numpy.meshgrid(x, 0, z)
# Combine into a single array
_ = numpy.stack(_, axis=-1)
# And flatten out to an array of (x, y, z)
location = _.reshape(-1, 3)
location = spacepy.coordinates.Coords(location, 'GSE', 'car', use_irbem=False)
# Assume a time
ticks = spacepy.time.Ticktock([datetime.datetime(2000, 4, 6)] * len(location))
b = spacepy.irbempy.get_Bfield(ticks, location, extMag='T96')
b_mag, b_vec = b['Blocal'], b['Bvec']
b_mag = b_mag.reshape(len(x), len(z))
c = spacepy.coordinates.Coords(b_vec, 'GEO', 'car', ticks=ticks, use_irbem=False)
b_vec = c.convert('GSE', 'car').data.reshape(len(x), len(z), 3)
b_hat = b_vec / b_mag[..., None]
## PLOTTING STARTS HERE
fig = matplotlib.pyplot.figure(dpi=150)
ax = fig.add_subplot(111)
ax.pcolormesh(x, z, b_mag.transpose(), norm=matplotlib.colors.LogNorm(vmin=10,vmax=1e4))
ax.set_aspect('equal')
spacepy.pybats.add_planet(ax)
for lat in numpy.arange(-10, 25, 5):
    l = numpy.radians(lat)
    startx = numpy.sin(l)
    startz = numpy.cos(l)
    tracex, tracez = spacepy.pybats.trace2d.trace2d_rk4(
        b_hat[..., 0].transpose() * -1,
        b_hat[..., 2].transpose() * -1,
        startx, startz, x, z, ds=0.1)
    ax.plot(tracex, tracez, color='k', marker='', lw=0.75)
The weird thing is if I plot several times (starting from PLOTTING STARTS HERE) I don't always get the same results:
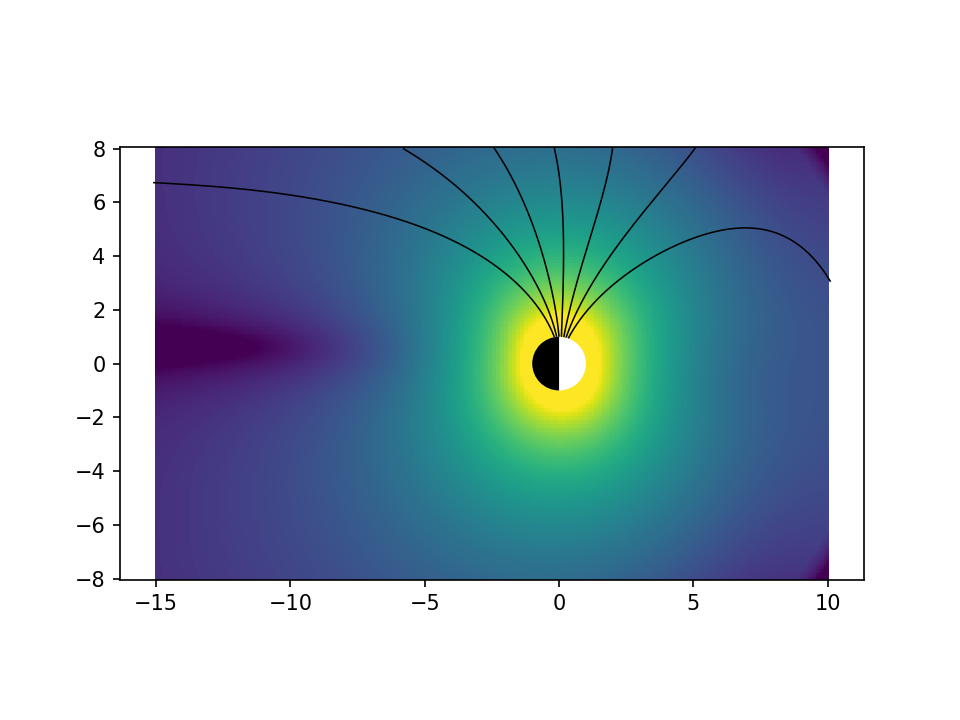
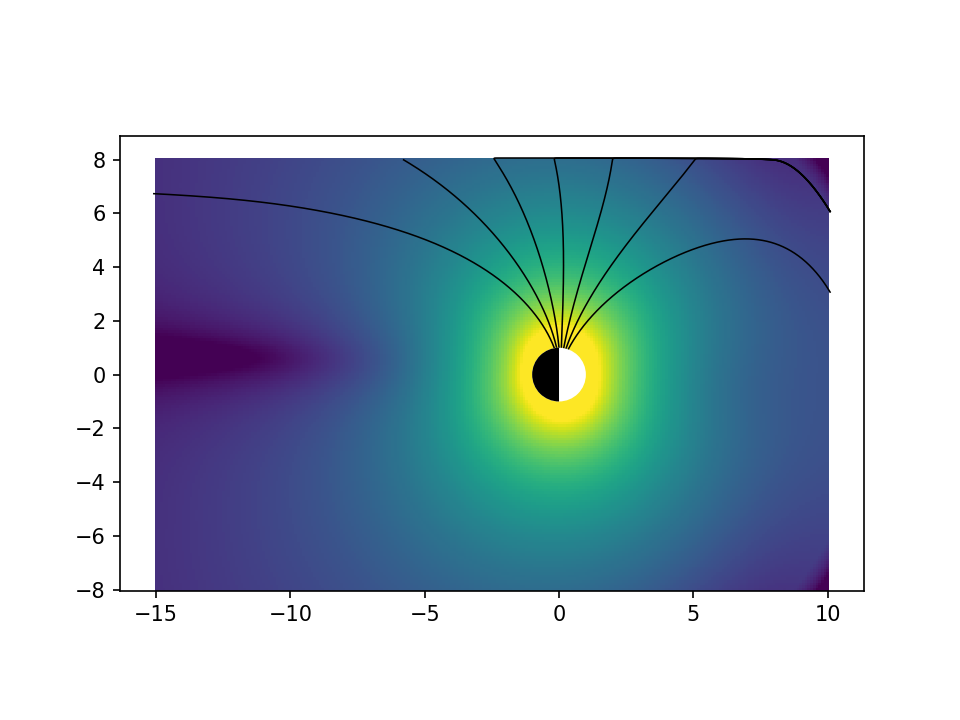 I'm not sure if this is a case where we're looking at genuine numerical instability or touching on uninitialized memory or what. Our output grid definitely starts uninitialized but that shouldn't be an issue.
It is possible that the real issue is touching uninitialized memory and that if that were fixed going outside the domain would be fine. But looking at the pointer math in grid_interp and the clamping inside the actual trace functions (where xloc/yloc are kept with an extra grid point between them and the edge), it sure looks good to me. Which means being able to clip to the domain would be really useful. Right now I'm clipping on output, which I suppose would be another option to add.
A related enhancement: it would be nice to have stop-when-you-hit areas; in particular I'm thinking of field line tracing to Earth. I suppose we could populate those with nan and then the tracing stops there? Maybe that's just a documentation issue.