integrate gather-style approach directly into spacegraphcats?
Now that the minimum metagenome covers paper is reasonably baked, I've been thinking about next steps towards strain-resolved metagenome decomposition.
reference dependence is a problem
A big (the big?) blocking point for reference-based approaches like sourmash in strain resolved metagenome decomposition is that the right strain is almost never going to actually be in the database. So you need approaches like sgc to pull out the right strain(s).
Now, over in genome-grist, we are using sourmash gather to build a minimum metagenome cover that can then be used as queries for sgc; basically, we search all of Genbank for matching genomes, and then pull those in as the right set of queries for sgc to use. So we are sort of using sgc as the final step in an approach that is otherwise limited by the references.
expanding minimum metagenome covers with spacegraphcats
What if we reversed this, and incorporated gather into sgc? I am envisioning the following:
- get best match A in gather to a metagenome query Q.
- run sgc with this best match, output as relevant strain bucket for A.
- subtract resulting k-mers from Q, as with gather.
- go to 1, get next match.
In practical terms, it would go something like this:
- run gather, download all matching genomes (so, grist :).
- provide them to sgc in gather order, and then instruct sgc to do the above procedure.
which, ok, now that I say it seems really simple... the key thing is that sgc queries in this mode would not be independent of each other as they currently are, you would probably be removing queries as you went.
actually implementing this soon
in terms of actual starting implementation, I think you could implement a slow version of this with the current genome-grist behavior pretty easily.
- build an sgc config with the make_sgc_conf target in genome-grist - DONE.
- execute sgc - DONE. (well, sometimes easier said than done, but let's just pretend.)
- then, do postprocessing on the results of sgc as in the procedure above, since you can be sure that the sgc execution contains all relevant results, even if it's a bit overkill and could be done more efficiently.
Some initial results on zymomock / SRR12324253 - you can see some substantial shifts in Cryptococcus, for example.
first round gather / minimum metagenome cover
overlap     p_query p_match avg_abund
---------   ------- ------- ---------
15.8 Mbp       0.4%   62.7%       2.6    SSXJ01000001.1 Cryptococcus neoforman..
.
11.3 Mbp       0.7%   97.6%       7.4    WMJW01000001.1 Saccharomyces cerevisi...
7.4 Mbp       30.0%   67.7%     461.6    JSPL01000060.1 Escherichia coli strai...
4.7 Mbp       24.7%   98.4%     607.9    VFAF01000002.1 Salmonella enterica st...
4.0 Mbp        2.8%   99.8%      80.1    CP039755.1 Bacillus subtilis strain N...
5.2 Mbp       13.3%   43.3%     474.1    FREP01002036.1 Escherichia coli isola...
2.8 Mbp        1.7%  100.0%      68.6    CP039751.1 Listeria monocytogenes str...
2.7 Mbp        4.6%   99.8%     192.8    VFAE01000004.1 Staphylococcus aureus ...
10.3 Mbp       0.0%   10.0%       2.2    AE017341.1 Cryptococcus neoformans va...
1.8 Mbp        6.2%   99.8%     395.3    CP039750.1 Limosilactobacillus fermen...
6.8 Mbp        6.2%   26.3%     394.4    CP041013.1 Pseudomonas aeruginosa str...
8.4 Mbp        0.0%    9.1%       1.9    CP003820.1 Cryptococcus neoformans va...
2.8 Mbp        3.5%   36.0%     391.4    CP039752.1 Enterococcus faecalis stra...
4.7 Mbp        5.0%   20.0%     604.4    VFAG01000002.1 Escherichia coli strai...
10.6 Mbp       0.1%    2.4%      16.5    LOQK01000001.1 Saccharomyces pastoria...
0.5 Mbp        0.0%    9.6%       1.3    VEMH01000100.1 Bacillus paranthracis ...
10.3 Mbp       0.0%    2.5%      10.7    CM010209.1 Saccharomyces cerevisiae s...
10.4 Mbp       0.0%    1.3%       3.8    CM006175.1 Saccharomyces cerevisiae s...

found 18 matches total;
the recovered matches hit 99.2% of the query
second round / neighborhoods
this is what I'm tentatively calling the 'graph-augmented minimum metagenome cover'.
overlap     p_query p_match avg_abund
---------   ------- ------- ---------
20.3 Mbp      35.7%  100.0%     200.1    nbhd:JSPL01000060.1 Escherichia coli ...
19.5 Mbp       0.4%  100.0%       2.4    nbhd:SSXJ01000001.1 Cryptococcus neof...
12.7 Mbp       0.7%   99.9%       6.7    nbhd:WMJW01000001.1 Saccharomyces cer...
12.8 Mbp      24.4%   96.0%     226.4    nbhd:VFAF01000002.1 Salmonella enteri...
13.7 Mbp      12.4%   49.0%     210.3    nbhd:FREP01002036.1 Escherichia coli ...
4.7 Mbp        2.8%   99.4%      67.7    nbhd:CP039755.1 Bacillus subtilis str...
3.8 Mbp        4.6%   99.3%     139.8    nbhd:VFAE01000004.1 Staphylococcus au...
3.6 Mbp        6.3%   99.4%     199.9    nbhd:CP039750.1 Limosilactobacillus f...
16.0 Mbp       4.6%   20.4%     161.6    nbhd:CP041013.1 Pseudomonas aeruginos...
3.3 Mbp        1.7%   98.7%      59.0    nbhd:CP039751.1 Listeria monocytogene...
12.0 Mbp       3.6%   14.2%     236.7    nbhd:VFAG01000002.1 Escherichia coli ...
5.4 Mbp        2.2%   24.8%     188.7    nbhd:CP039752.1 Enterococcus faecalis...
0.7 Mbp        0.0%   91.2%       1.3    nbhd:VEMH01000100.1 Bacillus paranthr...
16.2 Mbp       0.0%    3.7%       2.8    nbhd:AE017341.1 Cryptococcus neoforma...
15.1 Mbp       0.0%    3.0%       1.9    nbhd:CP003820.1 Cryptococcus neoforma...
12.6 Mbp       0.1%    3.1%      19.4    nbhd:LOQK01000001.1 Saccharomyces pas...
12.5 Mbp       0.0%    1.4%      29.4    nbhd:CM010209.1 Saccharomyces cerevis...
12.6 Mbp       0.0%    0.6%       8.0    nbhd:CM006175.1 Saccharomyces cerevis...

found 18 matches total;
the recovered matches hit 99.5% of the query
here's gather with just the cryptococcus results - picklists r awsum.
round 1
overlap     p_query p_match avg_abund
---------   ------- ------- ---------
15.8 Mbp       0.4%   62.7%       2.6    SSXJ01000001.1 Cryptococcus neoforman...
10.3 Mbp       0.0%   10.0%       2.4    AE017341.1 Cryptococcus neoformans va...
8.4 Mbp        0.0%    9.1%       1.9    CP003820.1 Cryptococcus neoformans va...

found 3 matches total;
the recovered matches hit 0.4% of the query
round 2
overlap     p_query p_match avg_abund
---------   ------- ------- ---------
19.5 Mbp       0.4%  100.0%       2.4    nbhd:SSXJ01000001.1 Cryptococcus neof...
16.2 Mbp       0.0%    3.7%       3.5    nbhd:AE017341.1 Cryptococcus neoforma...
15.1 Mbp       0.0%    3.0%       1.9    nbhd:CP003820.1 Cryptococcus neoforma...

found 3 matches total;
the recovered matches hit 0.4% of the query
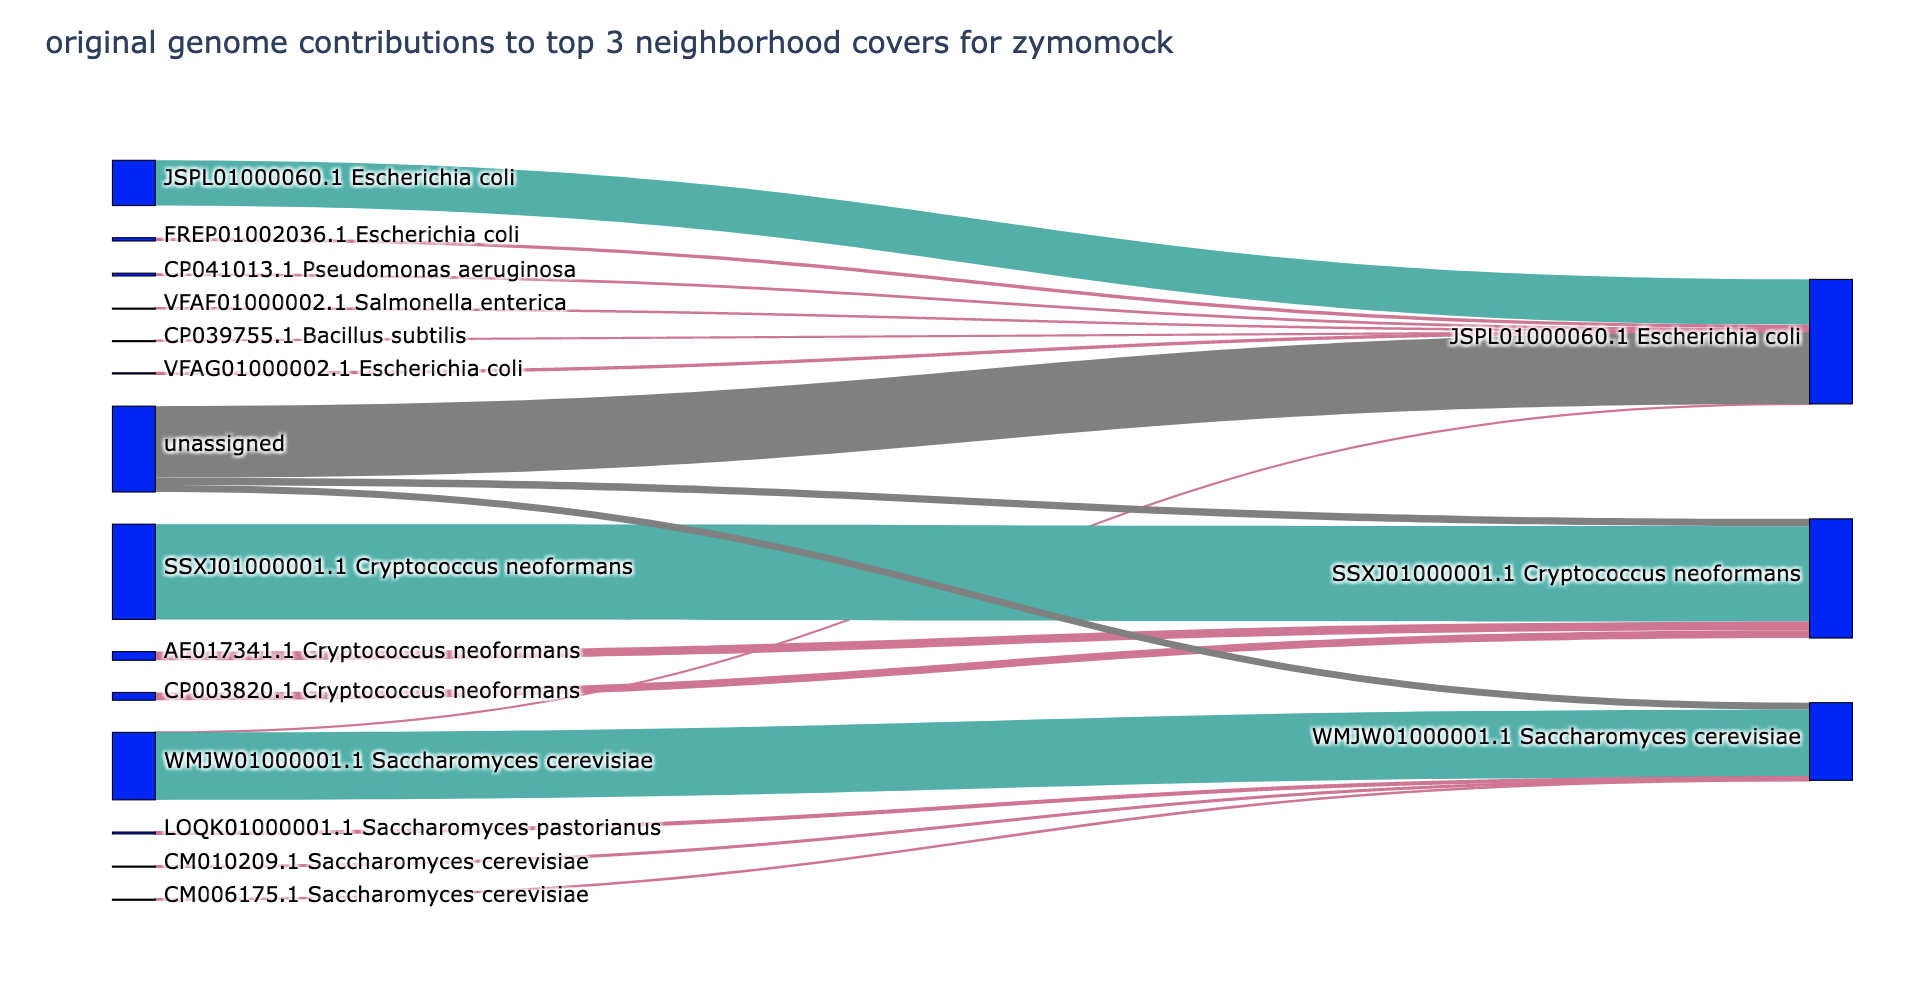
Interesting note: on the neighborhood gather (i.e. post spacegraphcats query), any reduction from 100% p_match is due to other (previous) neighborhoods "stealing" content. This is due to the nature of the greedy min-set-cov algorithm.
So, for example, in the below list for zymomock, 0.1% of the Saccharomyces neighborhood (rank 3) is overlapping with either E. coli or Cryptococcus.
Likewise, 4% of Salmonella (4th match) is stolen (probably by E. coli / rank 1) and 51% of the 5th match (a different strain of E. coli) is stolen, presumably mostly by E. coli / rank 1.
🤔 might be time to think about some upsetr plots to diagram that out, too.
overlap     p_query p_match avg_abund
---------   ------- ------- ---------
20.3 Mbp      35.7%  100.0%     200.1    nbhd:JSPL01000060.1 Escherichia coli ...
19.5 Mbp       0.4%  100.0%       2.4    nbhd:SSXJ01000001.1 Cryptococcus neof...
12.7 Mbp       0.7%   99.9%       6.7    nbhd:WMJW01000001.1 Saccharomyces cer...
12.8 Mbp      24.4%   96.0%     226.4    nbhd:VFAF01000002.1 Salmonella enteri...
13.7 Mbp      12.4%   49.0%     210.3    nbhd:FREP01002036.1 Escherichia coli ...
This is great! I think it's a really intuitive way to viz what's going on.
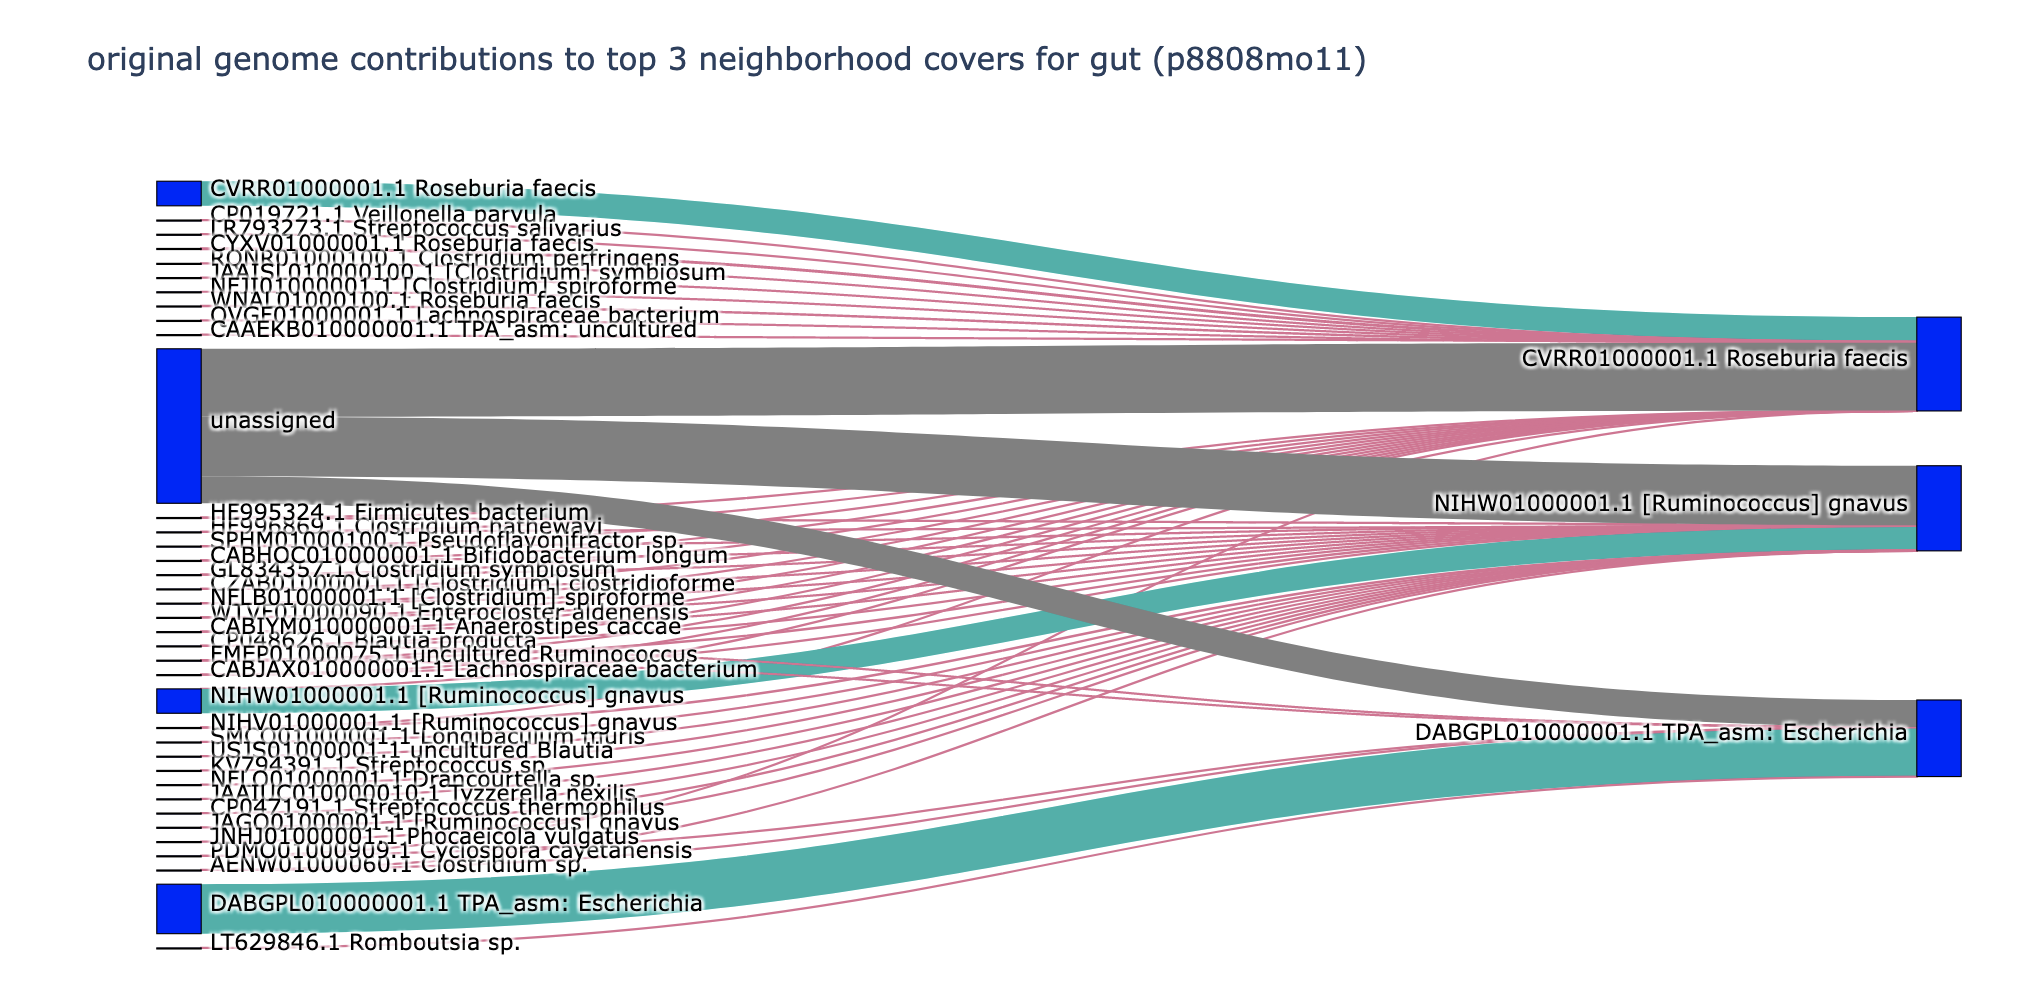
The grey flow I think matches what we think as the primary use case for spacegraphcats, and it's cool to see the viz of it. Most of the red lines in zymomock are great too! they make good "species umbrella," which is also an acceptable outcome. I'm concerned about some of the red lines in p8808mo11 though -- why are so many species getting scooped in? I'd love to know what sequences get scooped in -- horizontally transferred genes? core genes?