xcms
 xcms copied to clipboard
Extract MS2 spectra for chromatographic peaks and features
Development is going on in the ms2_spectra branch.
The aim is to extract MS2 spectra for an individual chromatographic peak (base function) as well as for a feature. The result should then be returned as a SpectrumList (being developed over at MSnbase, which allows to export them also as a mgf file.
The functions are in place. @michaelwitting if you want to test: chromPeakSpectra extracts MS2 spectra for chromatographic peaks, featureSpectra for features. Both return (at the moment) a list of Spectrum2 objects (as a list for each peak/feature). This might change if I can add the SpectrumList object to MSnbase.
Also, I need to implement the custom MGF export.
Great. I will test it later this day. Do you think that SpectrumList fits to MSnbase? For me it would fit better to XCMS, since it would be data structure for processed data... Just as a comment.
I thought it would fit because it is a very general object (essentually just a list of Spectrum objects with arbitrary metadata information. Let's see - eventually I'll add to xcms.
Everything is in place in the ms2_spectra branch (i.e. new Spectra object etc). Just waiting whether the class will not be included into MSnbase (could also be reused then in CompoundDb).
The function featureSpectra throws the following error:
Error in DataFrame(feature_id = fids, peak_id = vapply(strsplit(names(res), : different row counts implied by arguments
chromPeakSpectra works fine. The writeMgfData function writes a lot of masses with zero intensities.
@michaelwitting please update MSnbase (from github) and xcms from the github master branch. MSnbase 2.7.8 has Spectra present and the writeMgfData function to export Spectra objects. I made also some changes to the functions, so it could be that the featureSpectra works now. I will anyway test it on the files you provided.
I don't get an error anymore with featureSpectra with the new versions. Regarding the masses with zero intensities. Yes, indeed, there are a lot of 0 in the Spectrum2 objects. One would have to clean the spectra before writing. I made a pull request on MSnbase to add a clean,Spectra method. In the meantime 0s can be removed with:
ms2_features <- featureSpectra(processedData)
ms2_features@listData <- lapply(ms2_features, clean, all = TRUE)
Note that all = TRUE removes all 0 intensities. With all = FALSE it removes all 0 intensities except those immediately left and right of a peak.
Also be aware that there would be the possibility to just report one Spectrum2 per file/feature/peak with the method parameter of chromPeakSpectra and featureSpectra.
I'm getting the following error when using writeMgfData:
Error in (function (classes, fdef, mtable) : unable to find an inherited method for function ‘writeMgfData’ for signature ‘"Spectra"’
This is very strange. Can you please install MSnbase again from github? There is now a version 2.7.10. Also make sure you close R and start it again. You should then see:
> library(MSnbase)
> showMethods("writeMgfData")
Function: writeMgfData (package MSnbase)
object="MSnExp"
object="Spectra"
object="Spectrum"
> packageVersion("MSnbase")
[1] ‘2.7.10’
Top! It is running now... I will process and test with the test data.
BTW, an nicer solution to the intermediate approach ms2_features@listData <- lapply(ms2_features, clean, all = TRUE) would be to call ms2_features <- endoapply(ms2_features, clean, all = TRUE). Could however be that the pull request that adds clean,Spectra to MSnbase will already be merged today.
What about having a function that filter functions for the Spectra, e.g. keeping only the spectrum for one feature which has the highest TIC or having a merged consensus spectrum?
Did I miss it or was there a function in MSnbase to merge spectra?
Regarding selecting one Spectra per file and feature: you could either use the method parameter in featureSpectra to select the representative Spectrum2. I could also add a method = "TIC" to report the one with the largest TIC.
If you don't care from which file a Spectrum2 is (is that OK @michaelwitting ) you could also do the selection rather easily once you have the Spectra:
## Select for each feature the Spectrum2 with the largest TIC.
max_tic <- endoapply(split(ms2_features, mcols(ms2_features)$feature_id),
                     function(z) z[which.max(lapply(intensity(z), sum))])
max_tic <- unlist(max_tic)
Regarding merge of spectra, yes, there is the combineSpectra but I might have to tune this function a little as at present it throws an error if the spectra are not in profile mode.
Okay... I will use this workaround. At the moment I only want the highest TIC. Would be good to tweek the combineSpectra method to accept also centroided data from Spectrum1 and Spectrum
I made a pull request on combineSpectra on MSnbase - let's hope that gets into it soon (today?).
An update to illustrate what's possible with the combineSpectra from PR https://github.com/lgatto/MSnbase/pull/367
The idea is to first get all MS2 spectra for all chromatographic peaks associated to a feature from the LC-MS experiment. Then we want to define the consensus MS2 spectrum for each feature by combining the signal of all MS2 spectra. An important parameter is mzd which defines which (mass) peaks from different spectra are combined (peaks from the same or different files for which the difference of their m/z is < mzd are considered to be the same peak and their signal is combined). This is dependent on the resolution of the MS. For the consensus spectrum I require that a peak (for a given m/z considering also the mzd) is present in 75% of the MS2 spectra of a feature and I report the maximum intensity.
## Get all MS2 spectra associated with a chromatographic peak of a feature
ms2_features <- featureSpectra(processedData)

## Combine spectra: report the max if there is a peak signal present in 75% of
## spectra for one feature.
maxRequireProp <- function(x, numSpectra, minProp) {
    if ((length(x) / numSpectra) > minProp)
        max(x)
    else 0
}
ms2_list <- split(ms2_features, mcols(ms2_features)$feature_id)
res <- vector("list", length(ms2_list))
for (i in seq_along(res)) {
    res[[i]] <- combineSpectra(ms2_list[[i]], mzd = 0.005,
                               intensityFun = maxRequireProp,
                               minProp = 0.75,
                               numSpectra = length(ms2_list[[i]]))
}
## Create again a Spectra object and remove 0 intensity peaks
ms2_consensus <- Spectra(res, elementMetadata = DataFrame(
                                  feature_id = names(ms2_list)))
ms2_consensus <- clean(ms2_consensus, all = TRUE)
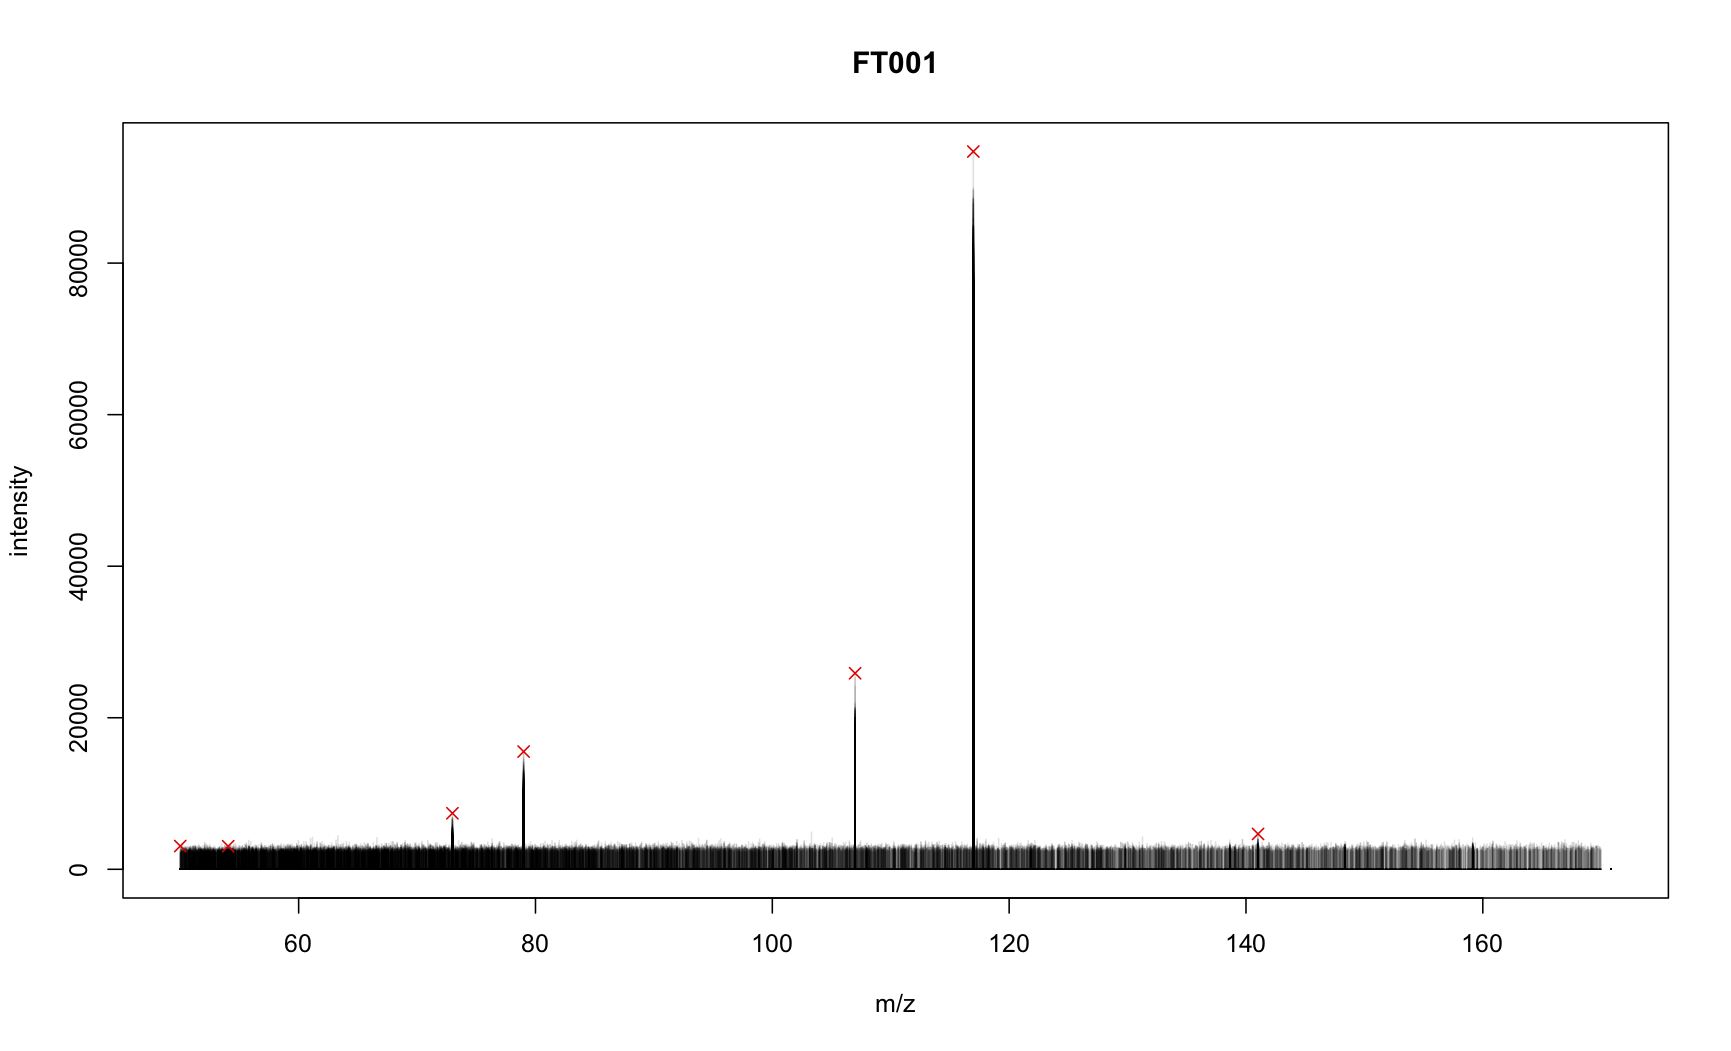
To evaluate the results we have a look at the MS2 spectra of the first feature (in total 491).
## Let's evaluate the results: plot all spectra for the first feature.
plot(3, 3, pch = NA, main = "FT001", xlim = range(mz(ms2_list[[1]])),
     ylim = range(intensity(ms2_list[[1]])), xlab = "m/z", ylab = "intensity")
tmp <- lapply(ms2_list[[1]], function(z) points(mz(z), intensity(z), type = "h",
                                               col = "#00000020"))
## Now indicate which peaks are present in the consensus spectrum
points(mz(ms2_consensus[[1]]), intensity(ms2_consensus[[1]]),
       pch = 4, col = "red")
The signal from all MS2 spectra for the feature are drawn in black (with transparency), the red crosses indicate the peaks present in the consensus MS2 peak.
Is this something useful @michaelwitting ?
I'm getting the following error:
Error in combineSpectra(ms2_list[[i]], mzd = 0.005, intensityFun = maxRequireProp, : unused arguments (minProp = 0.75, numSpectra = length(ms2_list[[i]]))
Do I need a specific branch from MSnbase? I installed the current master branch
But your output looks already great and this can be extremly usefull for many things!
I am currently working on the spectra_methods branch of MSnbase. But there might still be some updates/changes we need to make. Ultimately you will no longer need this for loop, as I'm implementing a combineSpectra method that works directly on a Spectra. The combineSpectra function I used above is actually renamed now into meanMzInts... as said, it's all not settled yet.
This is a fantastic idea and tool. I add to Michael's interest in its development. I would like to apply this to support broadly targeted MS/MS acquisition as described here: https://pubs.acs.org/doi/10.1021/acs.analchem.8b00929 . One feature of this MS/MS acquisition approach is that we adjust the collision energy - in the published example it is 10, 20, 30, or 40 V. It would be great if the final function as the ability to generate consensus spectra at each collision energy and then (optionally) aggregate the (in this case 4) consensus spectra into a single aggregate spectrum. Some of this could be done outside the main function, but it may make sense to have the "combineSpectra" function responsive to collision energy.
FYI - I did try the script above on the dataset I made for the paper, and it works nicely. The consensus portion less so, I suspect because of the differences in collision energy for spectra within a feature. Thanks for the effort going into this!
Hey Corey,
for SWATH data I'm currently splitting the data by the precursorMz, maybe something like this can be done for the collisionEnergy to get each one separated.
This is the code for splitting a SWATH data file into the different SWATH pockets:
`xrms_ms1 <- filterMsLevel(xrms, msLevel = 1) xrms_ms2 <- filterMsLevel(xrms, msLevel = 2)
precursors <- fData(xrms_ms2)$precursorMZ unique(precursors)
xrms_ms2_swath <- split(xrms_ms2, f = as.integer(precursors))`
You can use the spectra() and filterMsLevel() functions to isolate spectra of a specific MS level.
Maybe this is helpful.
If you can drop a file here (.mzML) I can try a few things.
Thanks for the feedback @cbroeckl ! As mentioned by @michaelwitting , it would be nice if you could share one file for testing purposes (along with some explanations).
we've implemented the combineSpectra for XCMSnExp objects, but also for Spectra objects. I think the Spectra objects (being just a list of Spectrum objects) might be really helpful here (they can be split in all different ways).
https://drive.google.com/open?id=1vObVkU6-QXbjEStpiTbItvDncVAvxQUz
a single mzML file can be downoaded from the above. It is standard MS/MS data structure, the only difference is that the MS/MS is fully scheduled before the start of the chromatographic run (based on previously processed data), and that the collision energies are not constant.
Thanks @cbroeckl , I'll have a look at it and come back to you if I have questions.
Thank you @jotsetung! I appreciate all the time you are putting into xcms.
I intend to use the spectrum retreival and combineSpectra functionality to arrive at a collective MS/MS spectrum (or one per collision energy) for each feature in the dataset - This function saves me the effort of having to find a way to organize and process all the MS/MS data myself.
@jotsetung Getting around to playing with this, and would like to get one more feature request in for this tool. I am using the featureSpectra() function to get all the spectra, and the split() function to break into feature specific spectra lists, and CE specific spectra. I can also use the combineSpectra() function to do some aggregating, with presence/absence filters for retrieving only the commonly observed features from the collection of MS2 spectra.
One additional feature that may be of value is to use some sort of intensity based filtering. i.e. the ratio of the precursor ion to the product ion has to be within some tolerance. the problem is that the precursorIntensity position in the Spectrum2 object is empty (0). I could write a function to try to go back and retrieve this, but obviously you are a better programmer than I and whatever gets built into XCMS3 benefits everyone, rather than just I.
So I would like to suggest that the precursorIntensity be filled with an interpolated precursor intensity based on the two flanking MS1 scans. i.e. if we have:
MS1: 122.1 seconds, prec intensity = 1000
MS2: 122.125 seconds
MS2: 122.15 seconds
MS2: 122.175 seconds
MS1 122.2 seconds, prec intensity = 9000,
we can approximate the precursor intensities: 122.125: 3000 122.15: 5000 122.175: 7000
Clearly not perfect, but gives us some reasonable value by which to compare product ions to. Feedback welcome of course. thanks again.
Nice suggestion @cbroeckl . What puzzles me is that precursorIntensity in your Spectrum2 object is 0 - This should be extracted correctly from the mzML.