xcms
 xcms copied to clipboard
How can a lower min peakwidth eliminate a peak?
Hi,
I found an optimization problem that is a bit strange to me. Lowering peakwidth causes a peak to disappear completely. I guess this is not really a bug but my understanding of centwave that fails.
See these 4 peaks:
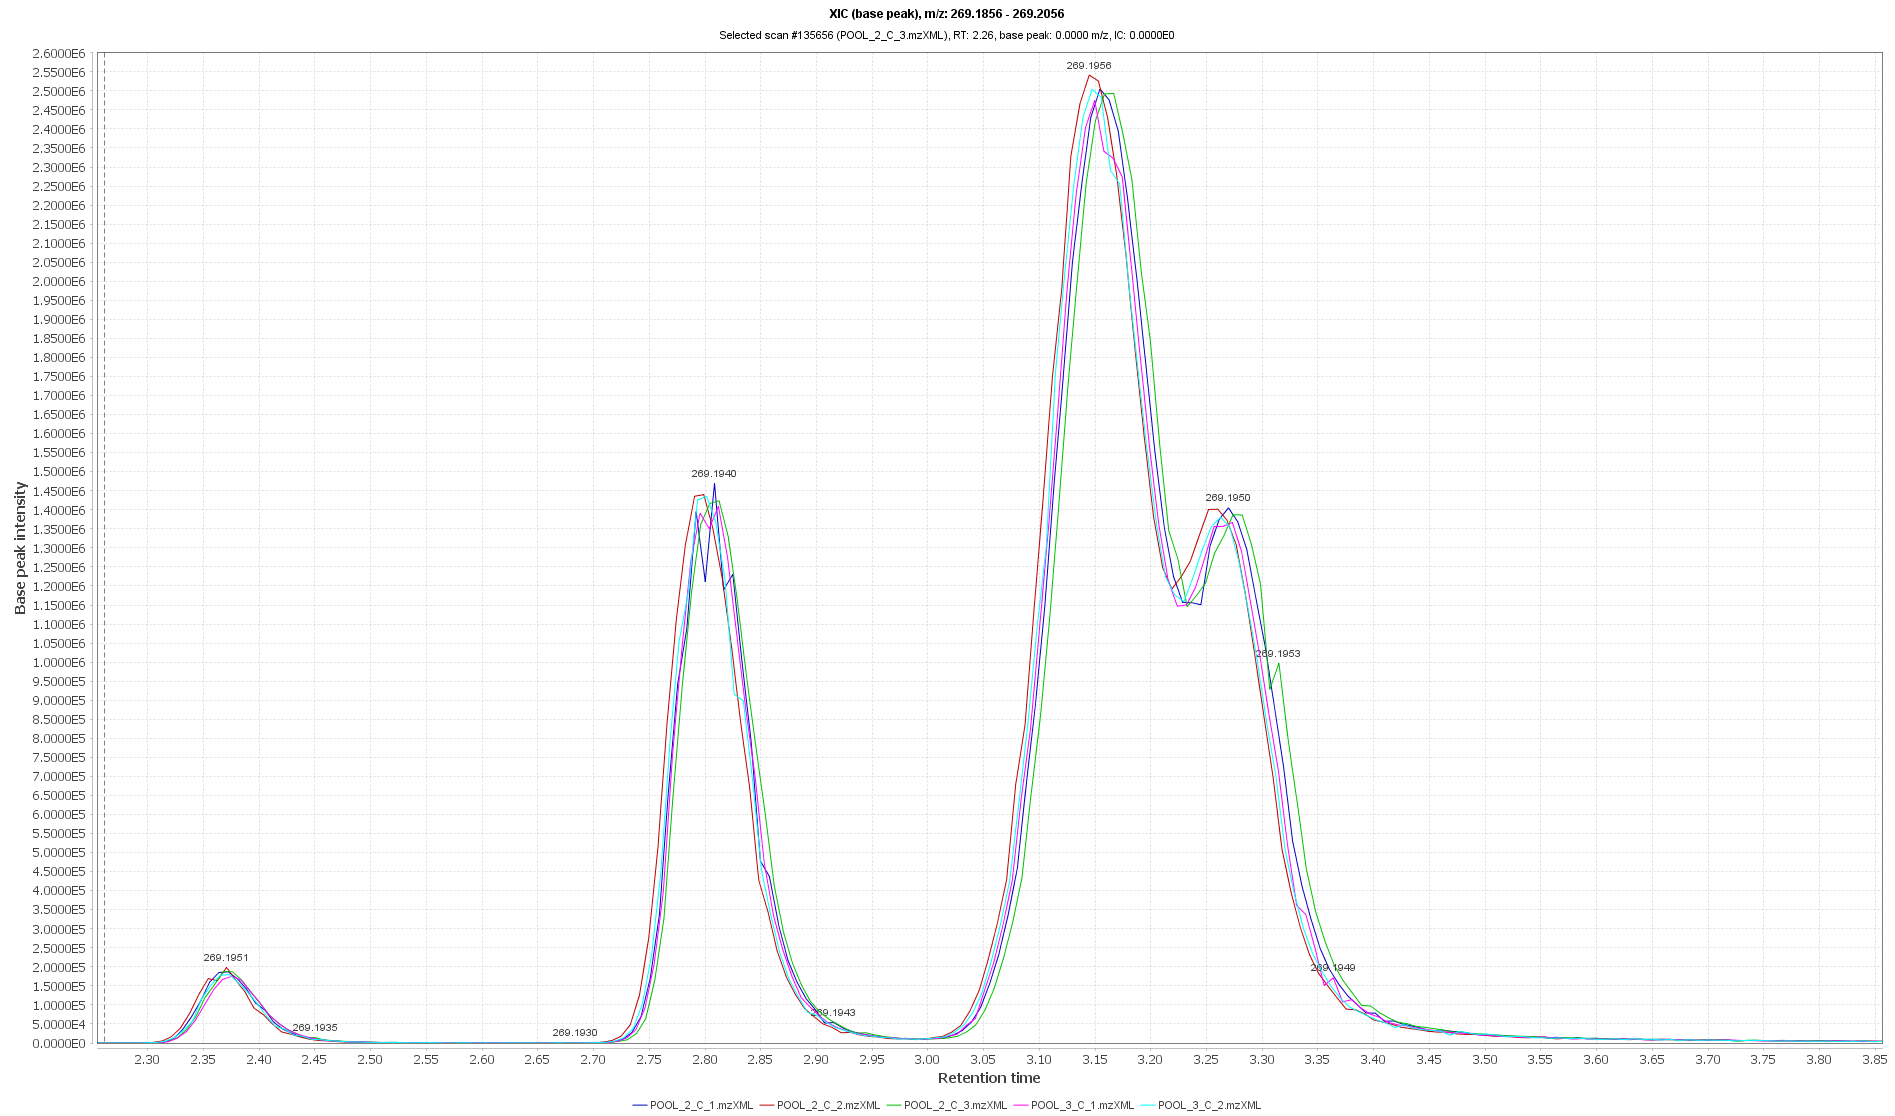
The test file is "_data/C/POOL_2_C_3.mzXML" from https://github.com/stanstrup/XCMS-course.
If I set min peakwidth to 0.05 min I get the the co-eluting peaks collapsed.
xset005 <- xcmsSet(files[24],
                BPPARAM  = SerialParam(),
                method = 'centWave',
                prefilter = c(3,1E3),
                ppm = 30,
                snthr = 1E2,
                profparam = list(step=0.005),
                peakwidth = c(0.05*60,0.20*60),
                verbose.columns	= TRUE,
                fitgauss = TRUE
                )
peaks <- peaks(xset005)

select <- peaks[,"mz"]>269.19 & peaks[,"mz"]<269.20
peaks[,c("rt", "rtmin", "rtmax")] <- peaks[,c("rt", "rtmin", "rtmax")]/60
peaks[select, ]
           mz    mzmin    mzmax       rt    rtmin    rtmax       into       intb      maxo   sn     egauss       mu    sigma         h    f dppm
[1,] 269.1945 269.1937 269.1949 2.376100 2.318450 2.433750   670616.2   669169.3  187905.5  602 0.04662363 288.9382 2.933544  185398.2 6856    2
[2,] 269.1950 269.1941 269.1960 3.217905 3.034933 3.389050 23642872.9 23633492.9 2493804.5 6203 0.14041652 387.8256 9.449052 2073445.6 9119    2
[3,] 269.1949 269.1944 269.1953 2.812583 2.746700 2.878467  6567585.0  6563960.8 1423619.2 3541 0.04722835 341.8024 3.747737 1451474.9 9119    2
     scale scpos scmin scmax lmin lmax sample
[1,]     3   289   286   292   36   50      1
[2,]    -1    -1    -1    -1   74  117      1
[3,]     3   341   338   344   39   55      1
If instead I use 0.02 the co-eluting peaks are separated but the first peak just disappears. Any idea how this can happen?
xset002 <- xcmsSet(files[24],
                BPPARAM  = SerialParam(),
                method = 'centWave',
                prefilter = c(3,1E3),
                ppm = 30,
                snthr = 1E2,
                profparam = list(step=0.005),
                peakwidth = c(0.02*60,0.20*60),
                verbose.columns	= TRUE,
                fitgauss = TRUE
                )
peaks <- peaks(xset002)

select <- peaks[,"mz"]>269.19 & peaks[,"mz"]<269.20
peaks[,c("rt", "rtmin", "rtmax")] <- peaks[,c("rt", "rtmin", "rtmax")]/60
peaks[select, ]
           mz    mzmin    mzmax       rt    rtmin    rtmax     into     intb    maxo   sn     egauss       mu    sigma       h    f dppm scale scpos
[1,] 269.1949 269.1944 269.1953 2.812583 2.746700 2.878467  6567585  6563665 1423619 3506 0.04722835 341.8024 3.747737 1451475 9119    2     3   341
[2,] 269.1953 269.1948 269.1960 3.166700 3.076117 3.232583 15813627 15809016 2493805 6143 0.03580060 384.9589 5.631110 2481000 9119    2     3   384
[3,] 269.1945 269.1943 269.1948 3.265533 3.232583 3.306717  6109847  6107541 1386943 3415 0.04335927 397.3786 6.170651 1371857 9119    2     1   400
     scmin scmax lmin lmax sample
[1,]   338   344   39   55      1
[2,]   381   387   79   98      1
[3,]   399   401   98  107      1
OK I kinda found the answer. If I lower S/N to 1E1 the peak appears. Even if S/N is reported as 394. So why was it eliminated with S/N 1E2?
OK I kinda found the answer. If I lower S/N to 1E1 the peak appears. Even if S/N is reported as 394. So why was it eliminated with S/N 1E2?
Hi @stanstrup
Did you ever figure out what the problem was? I am fooling around with centWave detection for targeted m/z & RT regions and I am observing the same behavior.
In short: I load in data
raw_data <- readMSData(msRawData, msLevel. = 1,mode = "onDisk")
I extract the chromatogram for a specific compound defined by m/z & rt
chr_raw <- chromatogram(raw_data, mz = c(131.08227,131.08293), rt = c(44.0,64.0))
Plotting reveals peak as expected (manually checked in Thermo XCalibur)
plot(chr_raw)
Searching for peak with these settings results in "No peaks found!"
Object of class:  CentWaveParam
 Parameters:
 - ppm: [1] 10
 - peakwidth: [1]  1 50
 - snthresh: [1] 3
 - prefilter: [1]    3 1000
 - mzCenterFun: [1] "wMean"
 - integrate: [1] 1
 - mzdiff: [1] -0.015
 - fitgauss: [1] FALSE
 - noise: [1] 1000
 - verboseColumns: [1] FALSE
 - roiList: list()
 - firstBaselineCheck: [1] TRUE
 - roiScales: numeric(0)
 - extendLengthMSW: [1] FALSE
> xchr <- findChromPeaks(chr_raw, param = param)
Warning message:
In peaksWithCentWave(int = c(F1.S0044 = NA, F1.S0045 = NA, F1.S0046 = NA,  :
  No peaks found!
When adjusting s/n, the peak appears for example when s/n = 0.5 Reported peak has a s/n of 3: so why was it not reported earlier, also not when s/n is for example = 2.
> chromPeaks(xchr)
          rt   rtmin   rtmax     into    intb    maxo sn row column
[1,] 52.7523 50.9014 56.3816 10248715 5654733 2895312  3   1      1
Thanks in advance! If you want to replicate you can find the used file here: https://filesender.belnet.be/?s=download&token=50f74913-59d1-496f-8994-b058440d5d20
Kind regards, Pablo
Nope. No idea.
This might be a bit rude to ask this way, but do @jorainer & @sneumann have knowledge of this behavior / is there an explanation? If not I'll go digging in the source code, but that will take some time I'm afraid. Thanks in advance and sorry for tagging you both like this.
Kind regards, Pablo
Some potential explanations Pablo that might help understanding the snthresh, in particular for peak detection on EIC - but be aware that I'm not the original developer of the algorithm, so there will be some internals that I actually miss:
- for running centWave on an EIC I would always lower the
snthreshbecause centWave has less signal to estimate proper S/N ratio (i.e. usually you have less signal in the chromatogram because you restrict the RT range (and m/z range). - centWave does a first crude noise estimation and only continues peak detection in that ROI if the several consecutive points are above that noise level. That can be disabled with
firstBaselineCheck = FALSE. First I thought it might be this, but disabling that did not help in your case.
The problem also is that centWave has several checks for signal above S/N within the algorithm that it's pretty hard to know where this problem comes from.
Hm, actually, I can not reproduce your example, as plot(chr_raw) on the 211201s013.mzXML file and your EIC extraction above gives me this:
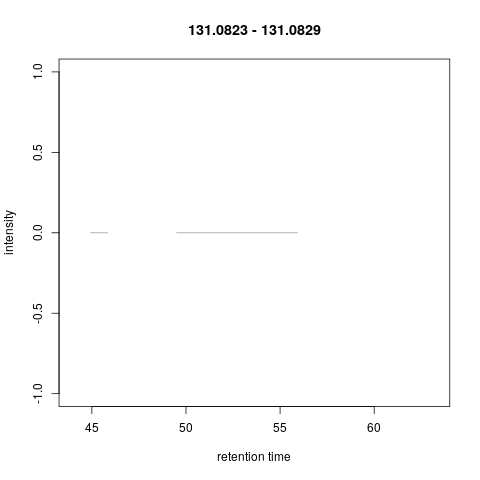
i.e. there is absolutely no peak in that RT m/z region in that file.
Hm, actually, I can not reproduce your example, as plot(chr_raw) on the 211201s013.mzXML file and your EIC extraction above gives me this:
i.e. there is absolutely no peak in that RT m/z region in that file.
Dear @jorainer Thanks for getting back to me and the explanation, it seems to me that is indeed harder to use the centWave peak picking algorithm on smaller chunks of the data instead of on the whole of the data...
Weird that you cannot reproduce the EIC, maybe I uploaded the wrong file (pos instead of neg ionisation). This one should be the correct one: https://filesender.belnet.be/?s=download&token=4d3722d1-9155-4c4a-a0bd-c4a8d4762dcb
raw_data <- readMSData(datafiles, msLevel. = 1,mode = "onDisk")

chr_raw <- chromatogram(raw_data, mz = c(131.08227,131.08293), rt = c(44.0,64.0))

plot(chr_raw)
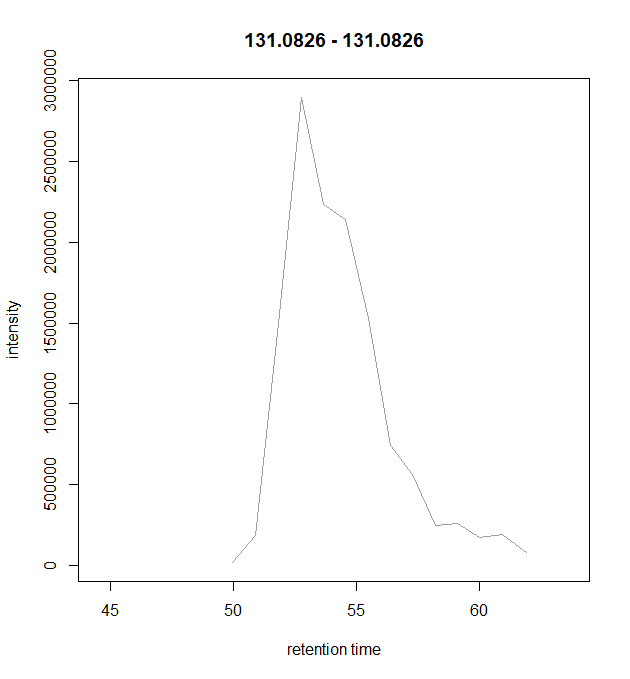
Yes, now I also get the EIC. But as you see, estimating the noise in such an EIC is pretty hard, because there is not much of a noise or background signal there. Thus, for peak detection on EICs (especially if they come from targeted approaches) I would rather use very low snthresh values to ensure you're actually detecting the peak. You can then always filter the identified peaks on the S/N later.
Yes, now I also get the EIC. But as you see, estimating the noise in such an EIC is pretty hard, because there is not much of a noise or background signal there. Thus, for peak detection on EICs (especially if they come from targeted approaches) I would rather use very low
snthreshvalues to ensure you're actually detecting the peak. You can then always filter the identified peaks on the S/N later.
Alright, makes sense! Thanks again for the effort to clarify!