snakemake
 snakemake copied to clipboard
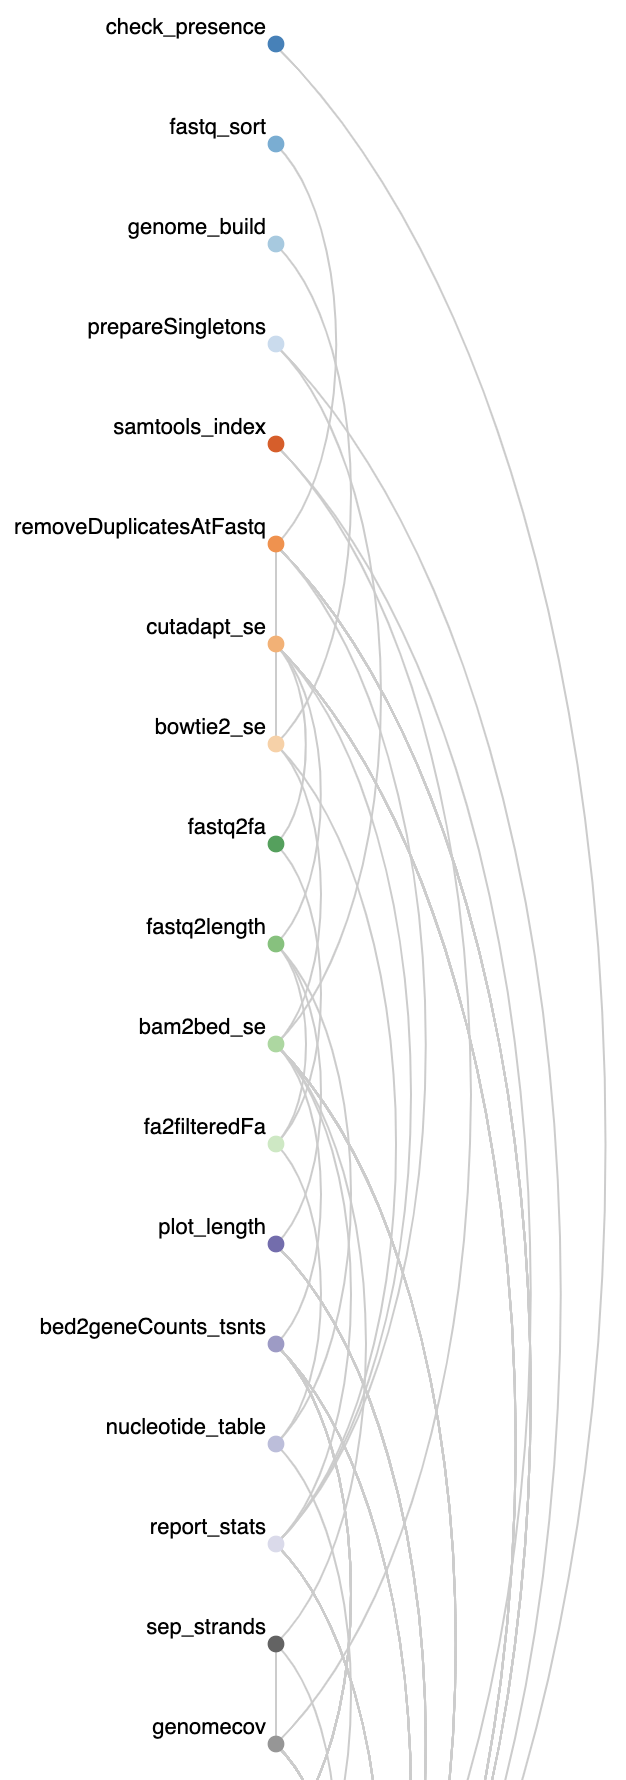
Report.html linear workflow graph
Snakemake version
7.17.0
Describe the bug
After I upgraded to version 7.17.0 I started to get an unexpected workflow graph.
The workflow graph in the report.html is linear as the following:
Logs
When I look at the error log I realized the following console log error:
Uncaught TypeError: Converting circular structure to JSON
    --> starting at object with constructor 'GroupItem'
    |     property 'mark' -> object with constructor 'Object'
    |     property 'items' -> object with constructor 'Array'
    --- index 0 closes the circle
    at JSON.stringify (<anonymous>)
    at _stringify (report.html:101010:23)
    at stringify (report.html:101069:8)
    at HTMLAnchorElement.<anonymous> (report.html:105072:21)
Minimal example
I was not able to reproduce the error with a minimal example.
Additional context
Thanks
I also encountered this and thought it was a new aesthetic choice. The correct graph is much easier to read
A fix or even an idea on how to monkey patch it would be much appreciated :)
Problem is still present in 7.32.3. It’s also present in the example report that is linked in Snakemake Documentation.
Does anyone have a workaround for this? (a custom CSS for instance?)
I looked a little into it, apparently the code is working as expected because the X coordinates of each node are hard-coded and always set to "10" in the vega template:
https://github.com/snakemake/snakemake/blob/27b224ed12448df8aebc7d1ff8f25e3bf7622232/snakemake/report/rulegraph_spec.py#L15
You can play a little interactively with the vega template that is generated by the Snakemake pytests here
I guess @johanneskoester probably did not find a good solution here and let this on hold for now. Basically, we only need a way to programmatically select and fx value for each node that optimize the DAG layout. We could also exploit one of the vega examples and see if something already exist for displaying a DAG-like figure, but I’m not really a vega expert...
Before version 7.2.0 (what we call the "old style report), this figure was generated using networkx and pygraphviz directly inside snakemake so this was not an issue.
Or maybe we could recover this deleted code from version 7.1.1 that generates the x/y coordinates of the DAG layout and inject them into the vega template:
https://github.com/snakemake/snakemake/blob/5355f5aae5e34ce94fbb16b552efa58526ae5370/snakemake/report/init.py#L562-L594
This creates a networkx/graphviz dependency but I guess it’s already used in the --rulegraph option so it’s cool?
Would that be a suitable solution or does any vega-expert see something "cleaner" that can be done?
I submitted a PR that fixes the layout. It adds back pygraphviz dependency though (as before version 7.2.0).
https://github.com/snakemake/snakemake/pull/2419
Are there any news on this issue? The Pull request seems to pass all tests.
@johanneskoester is this feature something that might be feasible to immplement in the new release?