Clicking "Host" does not match any logs, whereas searching Host does
Hey,
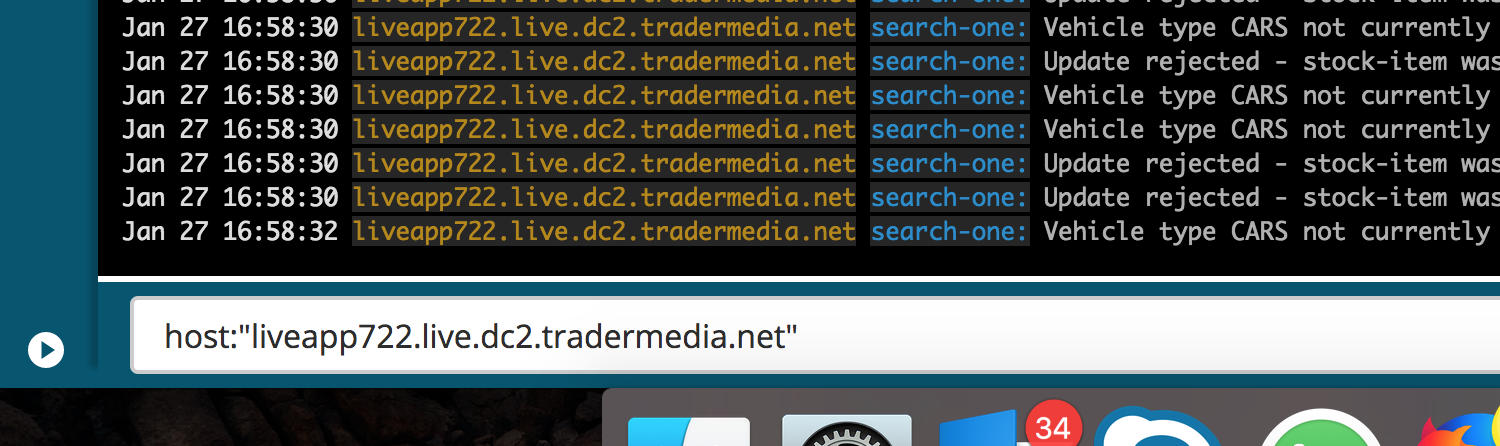
Take the following logs:
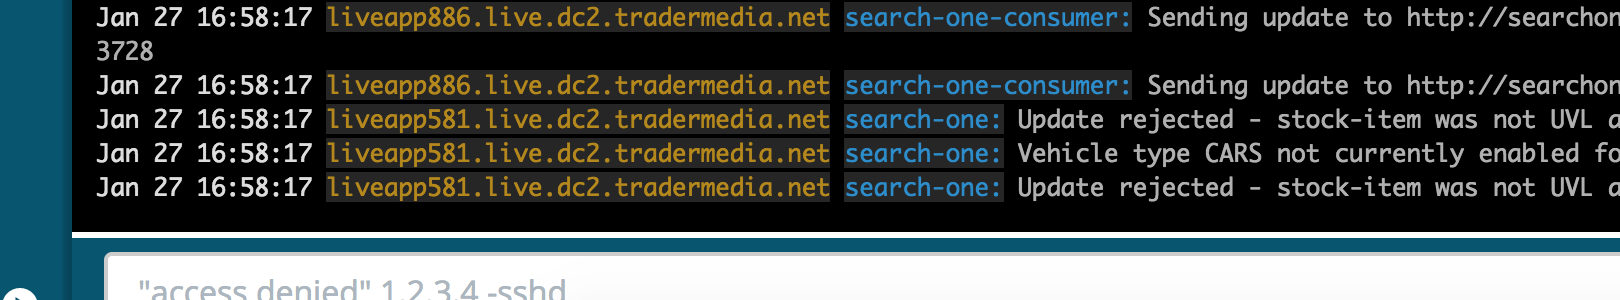
If i search for a host, it's fine:
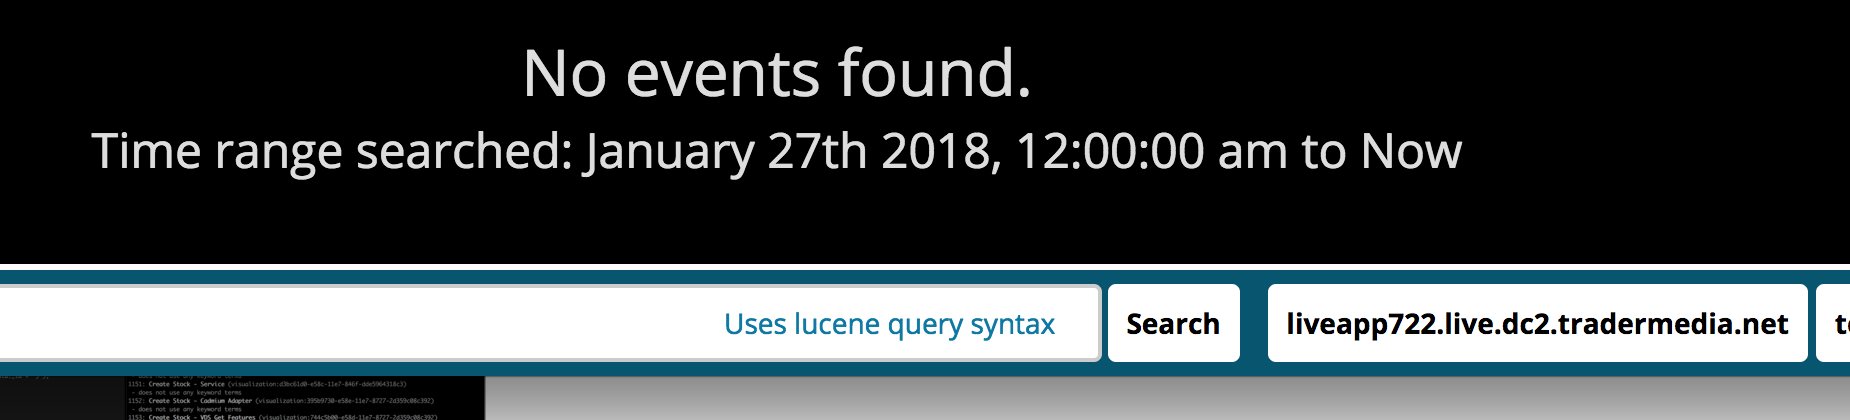
But if i select the host in the host drop down, I get no results:
This is on Kibana and elastic 6.1.2
Hey dude:
Logtrail on Kibana 6.1.2:
{
  "index_patterns" : [
    {
      "es": {
        "default_index": "applicationlogs-*",
        "allow_url_parameter": false
      },
      "tail_interval_in_seconds": 10,
      "es_index_time_offset_in_seconds": 0,
      "display_timezone": "local",
      "display_timestamp_format": "MMM DD HH:mm:ss",
      "max_buckets": 500,
      "nested_objects" : false,
      "default_time_range_in_days" : 1,
      "max_hosts": 100,
      "max_events_to_keep_in_viewer": 5000,
      "fields" : {
        "mapping" : {
            "timestamp" : "@timestamp",
            "display_timestamp" : "@timestamp",
            "hostname" : "host",
            "program": "application",
            "message": "message"
        }
      }
    },
    {
      "es": {
        "default_index": "serverlogs-*",
        "allow_url_parameter": false
      },
      "tail_interval_in_seconds": 10,
      "es_index_time_offset_in_seconds": 0,
      "display_timezone": "local",
      "display_timestamp_format": "MMM DD HH:mm:ss",
      "max_buckets": 500,
      "nested_objects" : false,
      "default_time_range_in_days" : 1,
      "max_hosts": 100,
      "max_events_to_keep_in_viewer": 5000,
      "fields" : {
        "mapping" : {
            "timestamp" : "@timestamp",
            "display_timestamp" : "@timestamp",
            "hostname" : "logsource",
            "program": "program",
            "message": "message"
        }
      }
    },
    {
      "es": {
        "default_index": "filebeat-*",
        "allow_url_parameter": false
      },
      "tail_interval_in_seconds": 10,
      "es_index_time_offset_in_seconds": 0,
      "display_timezone": "local",
      "display_timestamp_format": "MMM DD HH:mm:ss",
      "max_buckets": 500,
      "nested_objects" : false,
      "default_time_range_in_days" : 1,
      "max_hosts": 100,
      "max_events_to_keep_in_viewer": 5000,
      "fields" : {
        "mapping" : {
            "timestamp" : "@timestamp",
            "display_timestamp" : "@timestamp",
            "hostname" : "beat.hostname",
            "program": "fields.service",
            "message": "message"
        }
      }
    },
    {
      "es": {
        "default_index": "beats-*",
        "allow_url_parameter": false
      },
      "tail_interval_in_seconds": 10,
      "es_index_time_offset_in_seconds": 0,
      "display_timezone": "local",
      "display_timestamp_format": "MMM DD HH:mm:ss",
      "max_buckets": 500,
      "nested_objects" : false,
      "default_time_range_in_days" : 1,
      "max_hosts": 100,
      "max_events_to_keep_in_viewer": 5000,
      "fields" : {
        "mapping" : {
            "timestamp" : "@timestamp",
            "display_timestamp" : "time",
            "hostname" : "kubernetes.pod.name",
            "program": "kubernetes.labels.app",
            "message": "log"
        }
      }
    }
  ]
}
All the imputs are set up the same sort of dynamic mappings:
{
  "index_patterns": [
    "applicationlogs-*"
  ],
  "settings": {
    "number_of_shards" : 6,
    "number_of_replicas": 1
  },
  "mappings": {
    "application-logs": {
      "dynamic_templates": [
        {
          "message_field":{
            "path_match":"message",
            "match_mapping_type":"string",
            "mapping":{
              "type":"text",
              "norms":false,
              "ignore_above": 384
            }
          }
        },
        {
          "string_fields":{
            "match":"*",
            "match_mapping_type":"string",
            "mapping":{
              "type":"keyword",
              "ignore_above": 256
            }
          }
        }
      ],
      "properties": {
        "logstash-shipping-deployment-revision": { "enabled": false },
        "logstash-shipping-hostname": { "enabled": false },
        "logstash-shipping-production": { "enabled": false },
        "logstash-shipping-version": { "enabled": false },
        "type": { "enabled": false },
        "tags": { "enabled": false }
      }
    }
  }
}
The issue is seen for all index patterns or only in case of applicationlogs-*?
Same issue on ES/K 7.1.0
However I'm using container.name as the host in my logtrail config file.
Maybe the system selection is strictly using host as in the ES search instead of the mapped field?
In the newer versions of logtrail, "keyword_suffix" : "keyword" property is added in the logtrail.json. Can you check if this property is present in your logtrail.json? If yes, please confirm from ES mapping, the container.hostname the field has .keyword field mapping whose type is keyword.
Hmm no it doesn't seem to have it exactly. This is the mapping generated by filebeat setup configured to autodiscover docker.
filebeat-index-mapping.json.txt
Looks like container.name is directly mapped to keyword type. Can you set "keyword_suffix" : "" in logtrail.json, restart Kibana and check?