"Total Transfer Size" and "Total Requests" are incorrect on pages summary and side by side report
Have you read the documentation?
- [X] Yes, I've read the how to make a reproducable bug guide
- [X] Yes, I've read the how to debug my script guide
URL
https://www.sitespeed.io/
What are you trying to accomplish
I tried to receive median values for "Total Transfer Size" and "Total Requests" on "Pages" tab with summary values after several iterations.
Also, whould be better to see Median, Mean, stddev values on "Side by side" view.
What browser did you use?
Chrome
How to reproduce
1. Run `docker run --rm -v "$(pwd):/sitespeed.io" sitespeedio/sitespeed.io:26.1.0 https://www.sitespeed.io/`
2. Open received report on Pages tab
3. Also, open Side by side report
4. Check
Results:
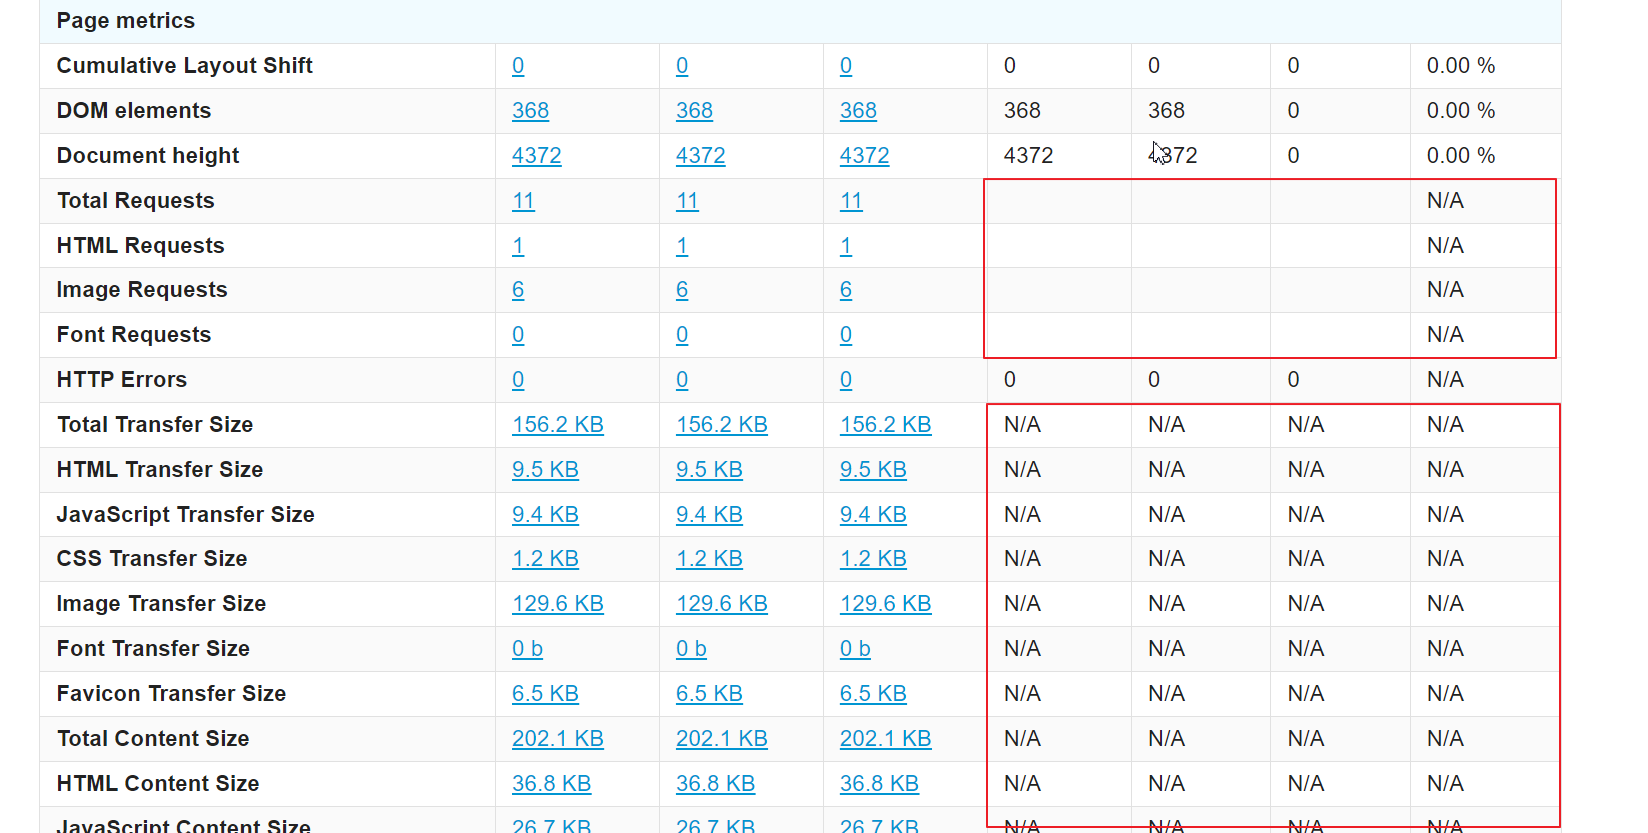
- Value from 1st iteration is taken for "Total Transfer Size" and "Total Requests" in summary table (hard to see on regular sites)
- N/A or empty values are shown for most Median, Mean, stddev metrics from blocks "Page metrics" and "Party metrics"
In my case several URLs and scenarios with alias are tested using js file (if it's also important), but reproduced with one URL also
Relevant log output
Google Chrome 106.0.5249.119
Mozilla Firefox 106.0
Microsoft Edge 106.0.1370.52
[2023-03-21 11:33:36] INFO: Versions OS: linux 5.10.16.3-microsoft-standard-WSL2 nodejs: v16.16.0 sitespeed.io: 26.1.0 browsertime: 16.17.0 coach: 7.1.2
[2023-03-21 11:33:36] INFO: Running tests using Chrome - 3 iteration(s)
[2023-03-21 11:33:38] INFO: Testing url https://www.sitespeed.io/ iteration 1
[2023-03-21 11:33:46] INFO: Take after page complete check screenshot
[2023-03-21 11:33:47] INFO: Take cumulative layout shift screenshot
[2023-03-21 11:33:47] INFO: Take largest contentful paint screenshot
[2023-03-21 11:33:50] INFO: Get visual metrics from the video
[2023-03-21 11:33:52] INFO: https://www.sitespeed.io/ TTFB: 175ms DOMContentLoaded: 325ms firstPaint: 274ms FCP: 274ms LCP: 384ms Load: 360ms CLS:0.0004
[2023-03-21 11:33:52] INFO: VisualMetrics: FirstVisualChange: 336ms SpeedIndex: 348ms VisualComplete85: 404ms LastVisualChange: 404ms
[2023-03-21 11:33:53] INFO: Testing url https://www.sitespeed.io/ iteration 2
[2023-03-21 11:34:02] INFO: Take after page complete check screenshot
[2023-03-21 11:34:02] INFO: Take cumulative layout shift screenshot
[2023-03-21 11:34:02] INFO: Take largest contentful paint screenshot
[2023-03-21 11:34:05] INFO: Get visual metrics from the video
[2023-03-21 11:34:08] INFO: https://www.sitespeed.io/ TTFB: 147ms DOMContentLoaded: 331ms firstPaint: 247ms FCP: 247ms LCP: 351ms Load: 331ms CLS:0.0004
[2023-03-21 11:34:08] INFO: VisualMetrics: FirstVisualChange: 267ms SpeedIndex: 274ms VisualComplete85: 300ms LastVisualChange: 333ms
[2023-03-21 11:34:08] INFO: Testing url https://www.sitespeed.io/ iteration 3
[2023-03-21 11:34:17] INFO: Take after page complete check screenshot
[2023-03-21 11:34:17] INFO: Take cumulative layout shift screenshot
[2023-03-21 11:34:18] INFO: Take largest contentful paint screenshot
[2023-03-21 11:34:20] INFO: Get visual metrics from the video
[2023-03-21 11:34:23] INFO: https://www.sitespeed.io/ TTFB: 285ms DOMContentLoaded: 545ms firstPaint: 370ms FCP: 370ms LCP: 453ms Load: 630ms CLS:0.0004
[2023-03-21 11:34:23] INFO: VisualMetrics: FirstVisualChange: 387ms SpeedIndex: 392ms VisualComplete85: 419ms LastVisualChange: 548ms
[2023-03-21 11:34:23] INFO: https://www.sitespeed.io/ 11 requests, TTFB: 175ms (σ60.00ms 29.4%), firstPaint: 274ms (σ53.00ms 17.8%), firstVisualChange: 336ms (σ49.00ms 14.9%), FCP: 274ms (σ53.00ms 17.8%), DOMContentLoaded: 331ms (σ102.00ms 25.6%), LCP: 384ms (σ42.00ms 10.7%), CLS: 0.0004 (σ0.00 0%), TBT: 0ms (σ0.00ms 0%), Load: 360ms (σ135.00ms 30.6%), speedIndex: 348ms (σ49.00ms 14.4%), visualComplete85: 404ms (σ53.00ms 14.1%), lastVisualChange: 404ms (σ89.00ms 20.9%) (3 runs)
[2023-03-21 11:34:25] INFO: HTML stored in /sitespeed.io/sitespeed-result/www.sitespeed.io/2023-03-21-11-33-36
Hi @stegalin thanks for creating the issue. When we first created sitespeed.io I think the idea was that you always test against the same content so it will never differ, that's we don't collect stats for how the page is built, but I guess then you have examples where it actually differs and will make difference, can please share that URL so I get a better understanding how it affect everything?
I think it would be cool to implement, I think it need to be behind a switch so you can turn it on/off. At the moment I buried in the fixes need to be done to release 27.0.0 and then I hope to move on with the web version of sitespeed.io, but I can help guide you how to implement if you have time?
Best Peter
Hi @soulgalore. Thanks for your response.
For example https://www.nbcnews.com/ where I received 14.2 MB, 17.1 MB, 14.2 MB Total Transfer Size in 3 iterations. If web site has somekind of dynamic content or some problems with content loading or A/B testing is going there (maybe wrong implemented but provides different results), good to know mean value or/and difference instead of only first value in summary.
In my case, it was small content change on 1st iteration (adding object on the page - like image in empty list of previews), so, on second iteration page content was bigger. I have changed my script to have same initial state before steps.
I created the issue because:
- in documentation mentioned median values in summary table but used first for some of them
- we have values per iteration in side by side view but just don't calculate result values
Not sure about "the switch" because values in summary already can be switched to be shown or not, 1st iteration results can be opened if someone interested its values and also if values are the same, it will equal to the 1st iteration value.
I suppose that at least something have to be changed in https://github.com/sitespeedio/sitespeed.io/blob/main/lib/plugins/html/templates/url/summary/metrics/index.pug but I'm not good in pug and JS. But can try to take a look.
Thanks for your great tool!
Best regards Ivan