homer
 homer copied to clipboard
Grafana dashboard based on client ip's
Hi Team,
I'm looking for the way to make a dashboard in Grafana per customer. I think the best approach is to define it per customer IP/IP's
I'm able to get the current query's out of Grafana, I'm looking for the docs, or the way to define it per IP.
Can you describe a bit how to define this? Kind regards, Vincent Query out of Grafana.
Object request:Object url:"api/datasources/proxy/9/api/v1/query_range" method:"POST" data:Object query:"(sum(increase(heplify_method_response{target_name=~"()", method="INVITE", response="200"}[5m]))) / (sum(increase(heplify_method_response{target_name=~"()", method="INVITE", response="INVITE"}[5m])) - (sum(increase(heplify_method_response{target_name=~"()", method="INVITE", response=~"3.*|401|407"}[5m])) or sum(up) * 0)) * 160 * sum(rate(heplify_method_response{target_name=~"()", method="INVITE", response="INVITE"}[5m]))" start:1638960360 end:1639003560 step:60 hideFromInspector:false response:Object status:"success" data:Object resultType:"matrix" result:Array[1]
Hi. I tried to do that myself. The way I found is by using the fields "HEPLIFYSERVER_PROMTARGETIP" and "HEPLIFYSERVER_PROMTARGETNAME" in the HeplifyServer configuration.
By putting the IPs and the names of the clients in the same order, they can automatically be used to discriminate the SIP traffic of each client, but not the RTP statistics.
I hope that helps.
Hi mcebey, thanks for your reply, can you show/describe a little bit more of where which file I need to change.
cheers, vincent
always good to learn a bit myself. still searching for the best approach if it is doable only in Grafana or if indeed config files needs to be changed.
Hello,
First where you configure the HeplifyServer (in my case I use the docker version so it is in the docker-compse.yml) put in order the IP and the names of the clients so that the server creates the labels within the database.
Then in the dashboards you can use the target_name tag to access the customer tag to filter on the charts.
For example
In the configuration we use two SBC, (the IP are not real)
- "HEPLIFYSERVER_PROMTARGETIP=192.168.1.20, 192.168.2.20"
- "HEPLIFYSERVER_PROMTARGETNAME=i-SBC_AGU, i-SBC_UNI"
Then in a dashboar you can define a variable that is the IP labels
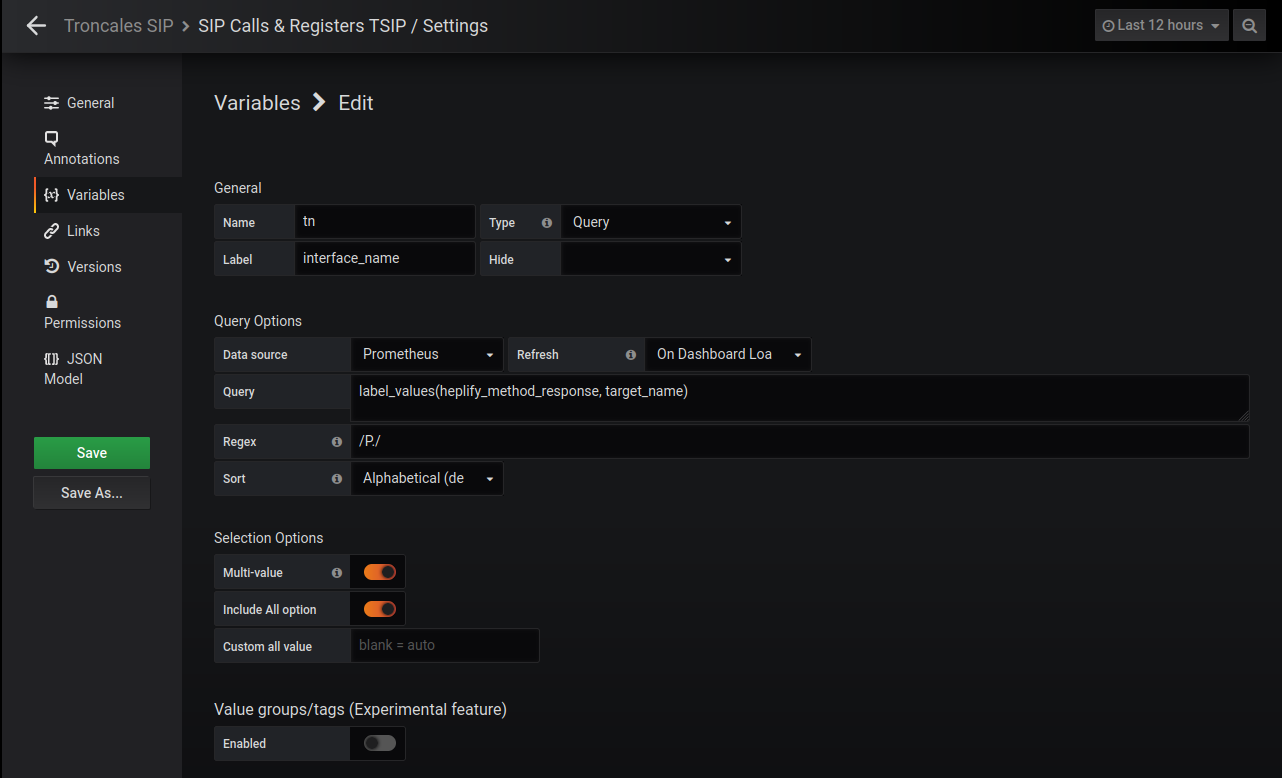
Finally you have to add the variable in the formula of the graph.
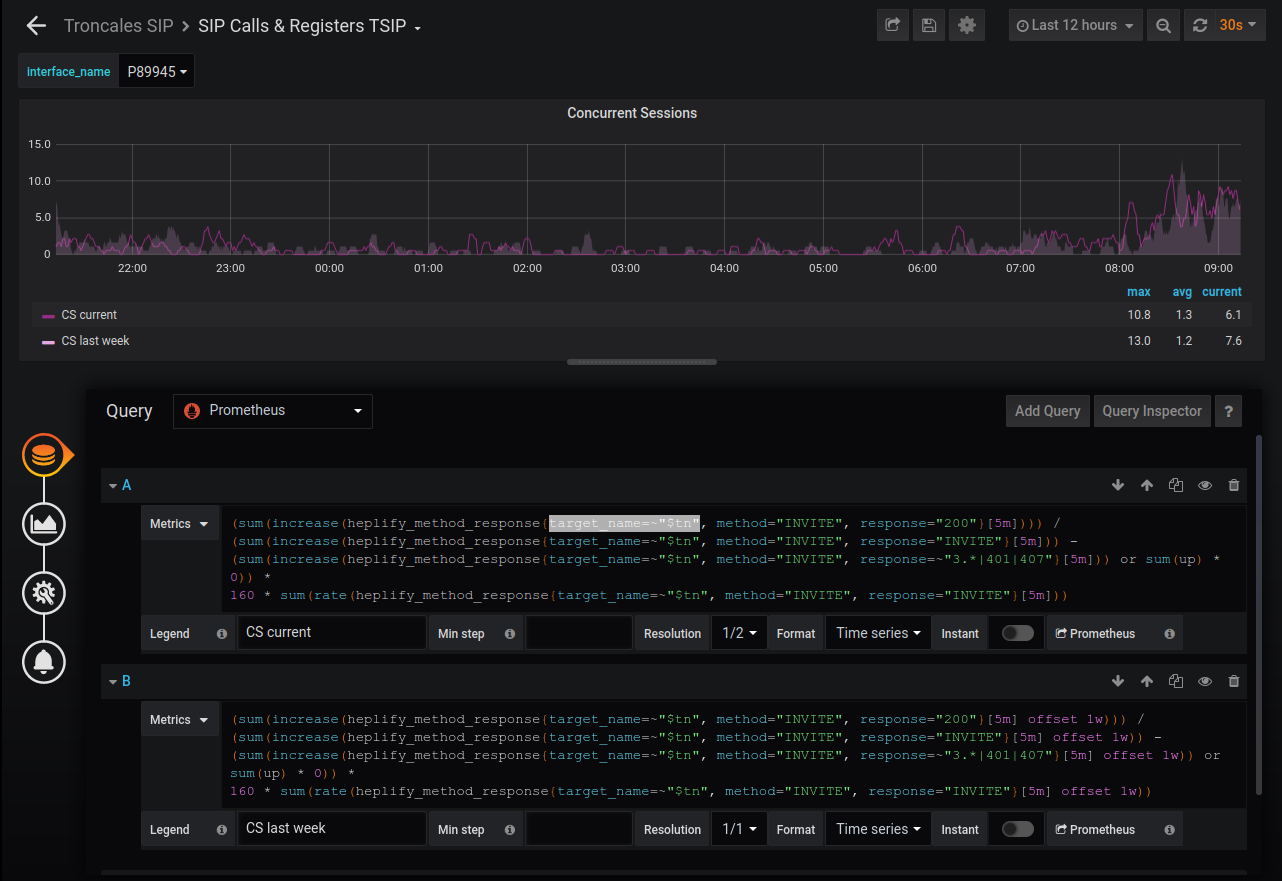
Then, filtering the created variable, you can access the client you want to visualize.
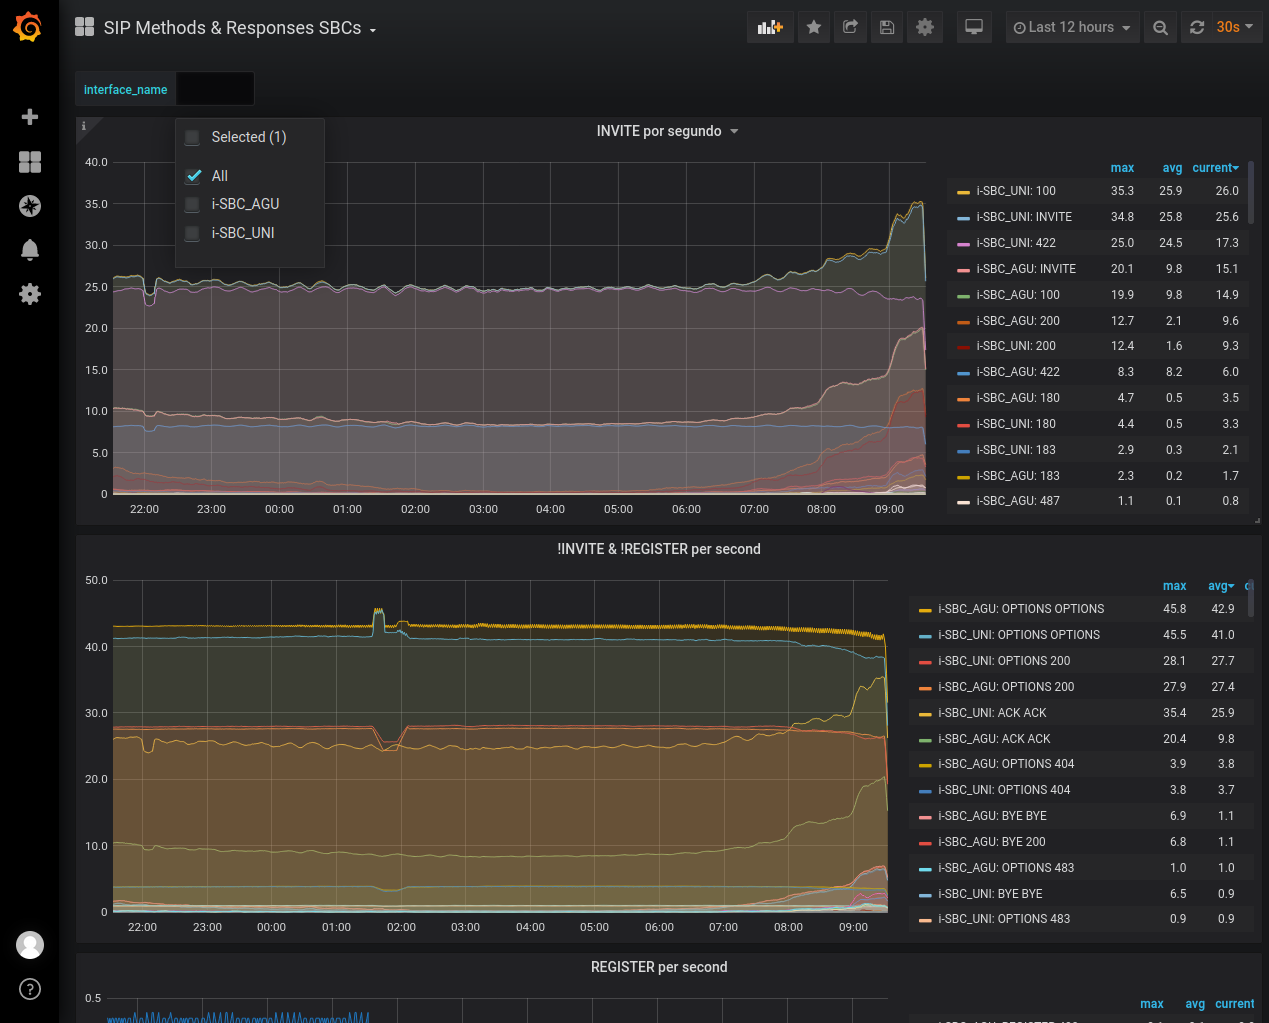
This is useful for some of the defined metrics, not so for others such as those of the QoS statistics where my conclusion is that you have to create the time series in the HeplifyServer (and I think you have to recompile for this)
I want to do kinda something similar: Displaying Dashboards per Customer but based on the "capture-id". Anyone could help me with that? Capture_id is already working inside Homer.