datasette
 datasette copied to clipboard
Research: demonstrate if parallel SQL queries are worthwhile
I added parallel SQL query execution here:
- https://github.com/simonw/datasette/issues/1723
My hunch is that this will take advantage of multiple cores, since Python's sqlite3 module releases the GIL once a query is passed to SQLite.
I'd really like to prove this is the case though. Just not sure how to do it!
Larger question: is this performance optimization actually improving performance at all? Under what circumstances is it worthwhile?
Wrote more about that here: https://simonwillison.net/2022/Apr/27/parallel-queries/
Compare https://latest-with-plugins.datasette.io/github/commits?_facet=repo&_facet=committer&_trace=1

With the same thing but with parallel execution disabled:
https://latest-with-plugins.datasette.io/github/commits?_facet=repo&_facet=committer&_trace=1&_noparallel=1

Those total page load time numbers are very similar. Is this parallel optimization worthwhile?
Maybe it's only worth it on larger databases? Or maybe larger databases perform worse with this?
I just remembered the --setting num_sql_threads option... which defaults to 3! https://github.com/simonw/datasette/blob/942411ef946e9a34a2094944d3423cddad27efd3/datasette/app.py#L109-L113
Would explain why the first trace never seems to show more than three SQL queries executing at once.
One weird thing: I noticed that in the parallel trace above the SQL query bars are wider. Mousover shows duration in ms, and I got 13ms for this query:
select message as value, count(*) as n from (
But in the ?_noparallel=1 version that some query took 2.97ms.
Given those numbers though I would expect the overall page time to be MUCH worse for the parallel version - but the page load times are instead very close to each other, with parallel often winning.
This is super-weird.
Relevant: here's the code that sets up a Datasette SQLite connection: https://github.com/simonw/datasette/blob/7a6654a253dee243518dc542ce4c06dbb0d0801d/datasette/database.py#L73-L96
It's using check_same_thread=False - here's the Python docs on that:
By default, check_same_thread is
Trueand only the creating thread may use the connection. If setFalse, the returned connection may be shared across multiple threads. When using multiple threads with the same connection writing operations should be serialized by the user to avoid data corruption.
This is why Datasette reserves a single connection for write queries and queues them up in memory, as described here.
I think I need some much more in-depth tracing tricks for this.
https://www.maartenbreddels.com/perf/jupyter/python/tracing/gil/2021/01/14/Tracing-the-Python-GIL.html looks relevant - uses the perf tool on Linux.
Also useful: https://avi.im/blag/2021/fast-sqlite-inserts/ - from a tip on Twitter: https://twitter.com/ricardoanderegg/status/1519402047556235264
Something worth digging into: are these parallel queries running against the same SQLite connection or are they each rubbing against a separate SQLite connection?
Just realized I know the answer: they're running against separate SQLite connections, because that's how the time limit mechanism works: it installs a progress handler for each connection which terminates it after a set time.
This means that if SQLite benefits from multiple threads using the same connection (due to shared caches or similar) then Datasette will not be seeing those benefits.
It also means that if there's some mechanism within SQLite that penalizes you for having multiple parallel connections to a single file (just guessing here, maybe there's some kind of locking going on?) then Datasette will suffer those penalties.
I should try seeing what happens with WAL mode enabled.
You don't want to re-use an SQLite connection from multiple threads anyway: https://www.sqlite.org/threadsafe.html
Multiple connections can operate on the file in parallel, but a single connection can't:
Multi-thread. In this mode, SQLite can be safely used by multiple threads provided that no single database connection is used simultaneously in two or more threads.
(emphasis mine)
I should try seeing what happens with WAL mode enabled.
I've only skimmed above but it looks like you're doing mainly read-only queries? WAL mode is about better interactions between writers & readers, primarily.
Yeah all of this is pretty much assuming read-only connections. Datasette has a separate mechanism for ensuring that writes are executed one at a time against a dedicated connection from an in-memory queue:
- https://github.com/simonw/datasette/issues/682
WAL mode didn't seem to make a difference. I thought there was a chance it might help multiple read connections operate at the same time but it looks like it really does only matter for when writes are going on.
This looks VERY relevant: SQLite Shared-Cache Mode:
SQLite includes a special "shared-cache" mode (disabled by default) intended for use in embedded servers. If shared-cache mode is enabled and a thread establishes multiple connections to the same database, the connections share a single data and schema cache. This can significantly reduce the quantity of memory and IO required by the system.
Enabled as part of the URI filename:
ATTACH 'file:aux.db?cache=shared' AS aux;
Turns out I'm already using this for in-memory databases that have .memory_name set, but not (yet) for regular file-backed databases:
https://github.com/simonw/datasette/blob/7a6654a253dee243518dc542ce4c06dbb0d0801d/datasette/database.py#L73-L75
Tried that and it didn't seem to make a difference either.
I really need a much deeper view of what's going on here.
Another avenue: https://twitter.com/weargoggles/status/1519426289920270337
SQLite has its own mutexes to provide thread safety, which as another poster noted are out of play in multi process setups. Perhaps downgrading from the “serializable” to “multi-threaded” safety would be okay for Datasette? https://sqlite.org/c3ref/c_config_covering_index_scan.html#sqliteconfigmultithread
Doesn't look like there's an obvious way to access that from Python via the sqlite3 module though.
Really wild idea: what if I created three copies of the SQLite database file - as three separate file names - and then balanced the parallel queries across all these? Any chance that could avoid any mysterious locking issues?
I should check my timing mechanism. Am I capturing the time taken just in SQLite or does it include time spent in Python crossing between async and threaded world and waiting for a thread pool worker to become available?
That could explain the longer query times.
Here's where read queries are instrumented: https://github.com/simonw/datasette/blob/7a6654a253dee243518dc542ce4c06dbb0d0801d/datasette/database.py#L241-L242
So the instrumentation is actually capturing quite a bit of Python activity before it gets to SQLite:
https://github.com/simonw/datasette/blob/7a6654a253dee243518dc542ce4c06dbb0d0801d/datasette/database.py#L179-L190
And then:
https://github.com/simonw/datasette/blob/7a6654a253dee243518dc542ce4c06dbb0d0801d/datasette/database.py#L204-L233
Ideally I'd like that trace() block to wrap just the cursor.execute() and cursor.fetchmany(...) or cursor.fetchall() calls.
Though it would be interesting to also have the trace reveal how much time is spent in the functions that wrap that core SQL - the stuff that is being measured at the moment.
I have a hunch that this could help solve the over-arching performance mystery.
Tried this but I'm getting back an empty JSON array of traces at the bottom of the page most of the time (intermittently it works correctly):
diff --git a/datasette/database.py b/datasette/database.py
index ba594a8..d7f9172 100644
--- a/datasette/database.py
+++ b/datasette/database.py
@@ -7,7 +7,7 @@ import sys
 import threading
 import uuid

-from .tracer import trace
+from .tracer import trace, trace_child_tasks
 from .utils import (
     detect_fts,
     detect_primary_keys,
@@ -207,30 +207,31 @@ class Database:
                 time_limit_ms = custom_time_limit

             with sqlite_timelimit(conn, time_limit_ms):
-                try:
-                    cursor = conn.cursor()
-                    cursor.execute(sql, params if params is not None else {})
-                    max_returned_rows = self.ds.max_returned_rows
-                    if max_returned_rows == page_size:
-                        max_returned_rows += 1
-                    if max_returned_rows and truncate:
-                        rows = cursor.fetchmany(max_returned_rows + 1)
-                        truncated = len(rows) > max_returned_rows
-                        rows = rows[:max_returned_rows]
-                    else:
-                        rows = cursor.fetchall()
-                        truncated = False
-                except (sqlite3.OperationalError, sqlite3.DatabaseError) as e:
-                    if e.args == ("interrupted",):
-                        raise QueryInterrupted(e, sql, params)
-                    if log_sql_errors:
-                        sys.stderr.write(
-                            "ERROR: conn={}, sql = {}, params = {}: {}\n".format(
-                                conn, repr(sql), params, e
+                with trace("sql", database=self.name, sql=sql.strip(), params=params):
+                    try:
+                        cursor = conn.cursor()
+                        cursor.execute(sql, params if params is not None else {})
+                        max_returned_rows = self.ds.max_returned_rows
+                        if max_returned_rows == page_size:
+                            max_returned_rows += 1
+                        if max_returned_rows and truncate:
+                            rows = cursor.fetchmany(max_returned_rows + 1)
+                            truncated = len(rows) > max_returned_rows
+                            rows = rows[:max_returned_rows]
+                        else:
+                            rows = cursor.fetchall()
+                            truncated = False
+                    except (sqlite3.OperationalError, sqlite3.DatabaseError) as e:
+                        if e.args == ("interrupted",):
+                            raise QueryInterrupted(e, sql, params)
+                        if log_sql_errors:
+                            sys.stderr.write(
+                                "ERROR: conn={}, sql = {}, params = {}: {}\n".format(
+                                    conn, repr(sql), params, e
+                                )
                             )
-                        )
-                        sys.stderr.flush()
-                    raise
+                            sys.stderr.flush()
+                        raise

             if truncate:
                 return Results(rows, truncated, cursor.description)
@@ -238,9 +239,8 @@ class Database:
             else:
                 return Results(rows, False, cursor.description)

-        with trace("sql", database=self.name, sql=sql.strip(), params=params):
-            results = await self.execute_fn(sql_operation_in_thread)
-        return results
+        with trace_child_tasks():
+            return await self.execute_fn(sql_operation_in_thread)

     @property
     def size(self):
Asked on the SQLite forum about this here: https://sqlite.org/forum/forumpost/ffbfa9f38e
I could try py-spy top, which I previously used here:
- https://github.com/simonw/datasette/issues/1673
Maybe this is the Python GIL after all?
I've been hoping that the GIL won't be an issue because the sqlite3 module releases the GIL for the duration of the execution of a SQL query - see https://github.com/python/cpython/blob/f348154c8f8a9c254503306c59d6779d4d09b3a9/Modules/_sqlite/cursor.c#L749-L759
So I've been hoping this means that SQLite code itself can run concurrently on multiple cores even when Python threads cannot.
But maybe I'm misunderstanding how that works?
I ran py-spy and then hammered refresh a bunch of times on the http://127.0.0.1:8856/github/commits?_facet=repo&_facet=committer&_trace=1&_noparallel= page - it generated this SVG profile for me.
The area on the right is the threads running the DB queries:

Interactive version here: https://static.simonwillison.net/static/2022/datasette-parallel-profile.svg
Useful theory from Keith Medcalf https://sqlite.org/forum/forumpost/e363c69d3441172e
This is true, but the concurrency is limited to the execution which occurs with the GIL released (that is, in the native C sqlite3 library itself). Each row (for example) can be retrieved in parallel but "constructing the python return objects for each row" will be serialized (by the GIL).
That is to say that if your have two python threads each with their own connection, and each one is performing a select that returns 1,000,000 rows (lets say that is 25% of the candidates for each select) then the difference in execution time between executing two python threads in parallel vs a single serial thead will not be much different (if even detectable at all). In fact it is possible that the multiple-threaded version takes longer to run both queries to completion because of the increased contention over a shared resource (the GIL).
So maybe this is a GIL thing.
I should test with some expensive SQL queries (maybe big aggregations against large tables) and see if I can spot an improvement there.
I could experiment with the await asyncio.run_in_executor(processpool_executor, fn) mechanism described in https://stackoverflow.com/a/29147750
Code examples: https://cs.github.com/?scopeName=All+repos&scope=&q=run_in_executor+ProcessPoolExecutor
The two most promising theories at the moment, from here and Twitter and the SQLite forum, are:
- SQLite is I/O bound - it generally only goes as fast as it can load data from disk. Multiple connections all competing for the same file on disk are going to end up blocked at the file system layer. But maybe this means in-memory databases will perform better?
- It's the GIL. The sqlite3 C code may release the GIL, but the bits that do things like assembling
Rowobjects to return still happen in Python, and that Python can only run on a single core.
A couple of ways to research the in-memory theory:
-
Use a RAM disk on macOS (or Linux). https://stackoverflow.com/a/2033417/6083 has instructions - short version:
hdiutil attach -nomount ram://$((2 * 1024 * 100)) diskutil eraseVolume HFS+ RAMDisk name-returned-by-previous-command (was `/dev/disk2` when I tried it) cd /Volumes/RAMDisk cp ~/fixtures.db . -
Copy Datasette databases into an in-memory database on startup. I built a new plugin to do that here: https://github.com/simonw/datasette-copy-to-memory
I need to do some more, better benchmarks using these different approaches.
https://twitter.com/laurencerowe/status/1519780174560169987 also suggests:
Maybe try:
- Copy the sqlite file to /dev/shm and rerun (all in ram.)
- Create a CTE which calculates Fibonacci or similar so you can test something completely cpu bound (only return max value or something to avoid crossing between sqlite/Python.)
I like that second idea a lot - I could use the mandelbrot example from https://www.sqlite.org/lang_with.html#outlandish_recursive_query_examples
Here's a very useful (recent) article about how the GIL works and how to think about it: https://pythonspeed.com/articles/python-gil/ - via https://lobste.rs/s/9hj80j/when_python_can_t_thread_deep_dive_into_gil
From that article:
For example, let's consider an extension module written in C or Rust that lets you talk to a PostgreSQL database server.
Conceptually, handling a SQL query with this library will go through three steps:
- Deserialize from Python to the internal library representation. Since this will be reading Python objects, it needs to hold the GIL.
- Send the query to the database server, and wait for a response. This doesn't need the GIL.
- Convert the response into Python objects. This needs the GIL again.
As you can see, how much parallelism you can get depends on how much time is spent in each step. If the bulk of time is spent in step 2, you'll get parallelism there. But if, for example, you run a
SELECTand get a large number of rows back, the library will need to create many Python objects, and step 3 will have to hold GIL for a while.
That explains what I'm seeing here. I'm pretty convinced now that the reason I'm not getting a performance boost from parallel queries is that there's more time spent in Python code assembling the results than in SQLite C code executing the query.
It would be really fun to try running this with the in-development nogil Python from https://github.com/colesbury/nogil
There's a Docker container for it: https://hub.docker.com/r/nogil/python
It suggests you can run something like this:
docker run -it --rm --name my-running-script -v "$PWD":/usr/src/myapp \
  -w /usr/src/myapp nogil/python python your-daemon-or-script.py
OK, I just got the most incredible result with that!
I started up a container running bash like this, from my datasette checkout. I'm mapping port 8005 on my laptop to port 8001 inside the container because laptop port 8001 was already doing something else:
docker run -it --rm --name my-running-script -p 8005:8001 -v "$PWD":/usr/src/myapp \
  -w /usr/src/myapp nogil/python bash
Then in bash I ran the following commands to install Datasette and its dependencies:
pip install -e '.[test]'
pip install datasette-pretty-traces # For debug tracing
Then I started Datasette against my github.db database (from github-to-sqlite.dogsheep.net/github.db) like this:
datasette github.db -h 0.0.0.0 --setting trace_debug 1
I hit the following two URLs to compare the parallel v.s. not parallel implementations:
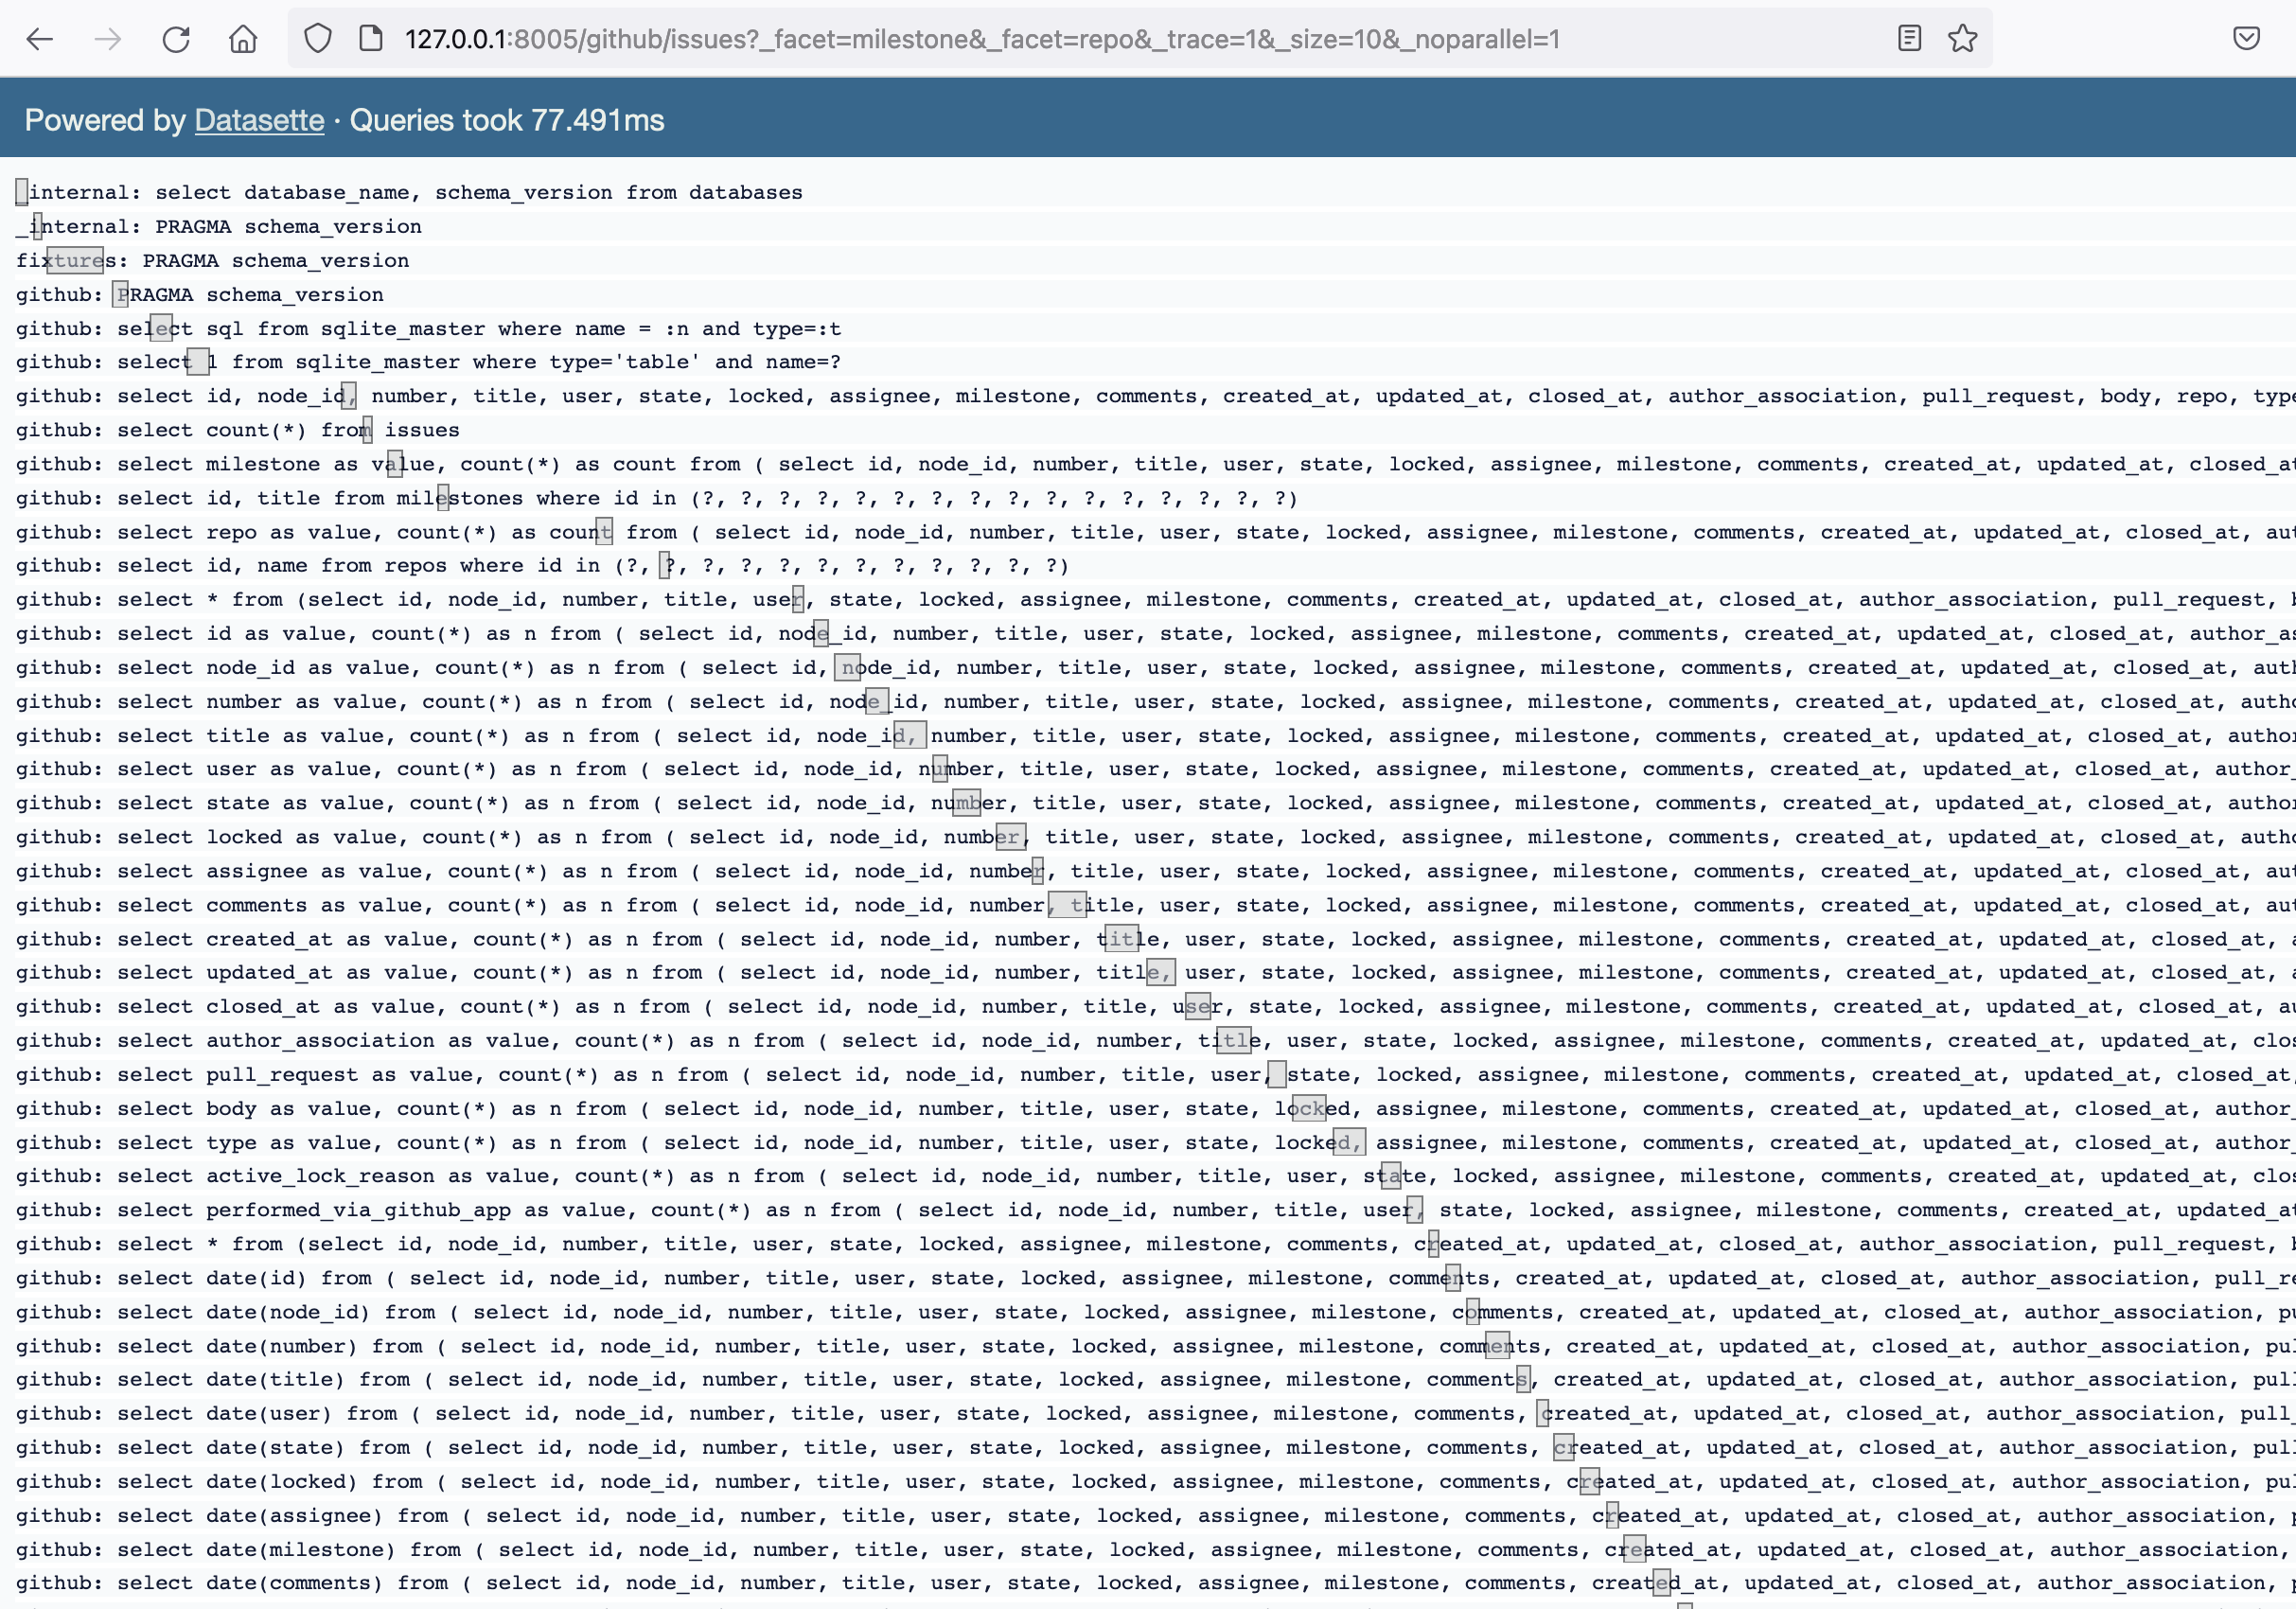
http://127.0.0.1:8005/github/issues?_facet=milestone&_facet=repo&_trace=1&_size=10http://127.0.0.1:8005/github/issues?_facet=milestone&_facet=repo&_trace=1&_size=10&_noparallel=1
And... the parallel one beat the non-parallel one decisively, on multiple page refreshes!
Not parallel: 77ms
Parallel: 47ms

So yeah, I'm very confident this is a problem with the GIL. And I am absolutely stunned that @colesbury's fork ran Datasette (which has some reasonably tricky threading and async stuff going on) out of the box!