go-debug
 go-debug copied to clipboard
A basic, web-based "interactive" debugger for Go.
go-debug
A basic, web-based "interactive" debugger for Go.
- Set "breakpoints".
- Watch variables
- ...in a browser!
Installation
$ go get github.com/simon-whitehead/go-debug
Quick start
Instantiate a Debugger instance on port 8080, watch a variable, and break.
import "github.com/simon-whitehead/go-debug"

func main() {
    debugger := godebug.NewDebugger(8080)
    i := 0

    debugger.Watch("i", &i)

    debugger.Break()

    i = 50

    debugger.Break()
}
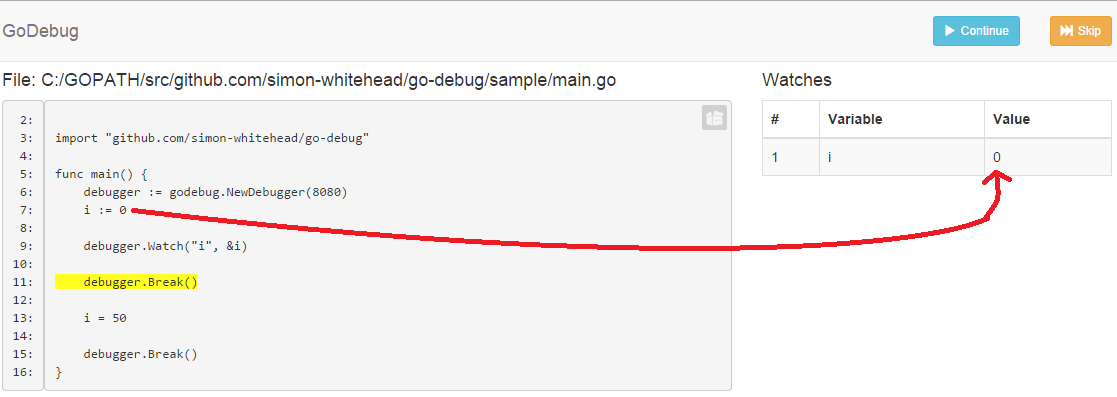
When your code runs, execution will stop at debugger.Break(). Your watch variable i will be visible in the browser window located at http://localhost:8080 (as specified in the code above - the port is configurable):
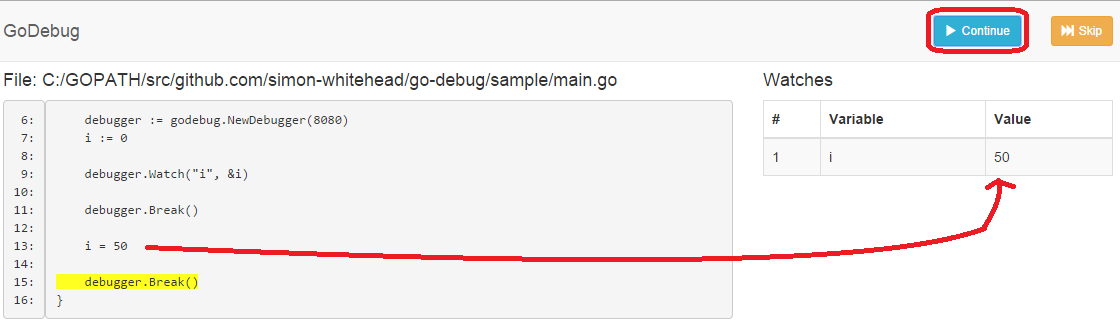
Clicking Continue will allow you to move to the next "breakpoint", and your watch variable i will update accordingly:
Notes
The debugger will jump between files, as long as you declare a global Debugger instance.
If you place a "breakpoint" in a loop/recurring function and you don't want to hit it, you can click Skip when you hit that breakpoint and the debugger will never break there again (for the rest of the debugging session).
Some of the runtime statistics cannot be considered gospel. Because the debugger requires pointers to watch variables, they will be rooted and escape analysis will mean the stacks won't grow quite as you expect.
I am aware this is very basic. Its just more "traditional" for people coming to Go from other languages with more interactive debuggers.
Contributing/suggestions
I am open to pull requests and/or suggestions.
Metadata
Owner
Metadata
A basic, web-based "interactive" debugger for Go.