pyreal

pyreal copied to clipboard
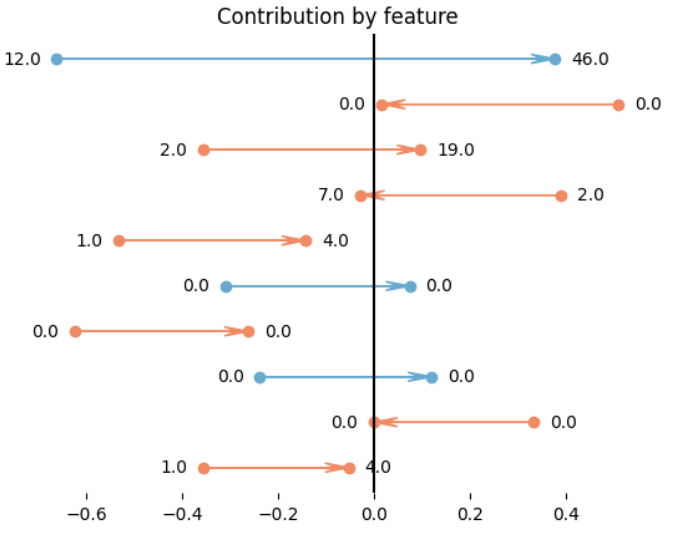
Add change-over-time plot
In some use-cases, it may be very useful to understand why a model prediction changes over time. For this issue, we will add the basic dumbbell plot to visualize which features led to the biggest change in prediction between two time frames
Will address after the first draft implementation in https://github.com/sibyl-dev/sibylapp2/issues/20