scylla-monitoring
 scylla-monitoring copied to clipboard
Display "most popular" queries/KSes/tables/partitions on a per-cluster/DC/node/shard level
System information Scylla version: f873806c7c985a5716b2d6b8c7459d45985326a9 Are you willing to contribute it: Yes
Describe the feature and the current behavior/state. We want to be able to see (a table?) of the most popular items in the cluster. Items may include:
- Queries as their CQL expression, e.g.
SELECT my_key, my_val FROM my_table where my_key = ?. - Keyspaces
- Tables: full name as
<KS name>.<CF name>. - Partition:
<full table name as above>: PK value and/or a corresponding token.
We want to be able to filter the above output as follows:
- For the whole cluster.
- For a given DC
- For a given node
- For a given shard
- Any combination of the above.
Who will benefit with this feature? Every Scylla user. This is going to bring the visibility about what the DB is currently doing to a different level.
@amnonh , need your advise -- would it be possible to display "top-10 most accessed ks names"-like information using prometheus+graphana stack?
If you're just looking for the most ks names and there aren't too many of them, it will be possible to add such a metrics and than report it. An alternatives: you can either take it from a log, or from a tabel (like we do for connection information)
If you're just looking for the most ks names and there aren't too many of them, it will be possible to add such a metrics and than report it. An alternatives: you can either take it from a log, or from a tabel (like we do for connection information)
When we think of a solution we should also remember that it should have the same ability of watching the historical data as in regular Monitoring.
We eventually implemented the "Displaying" solution using Loki (over the syslog):
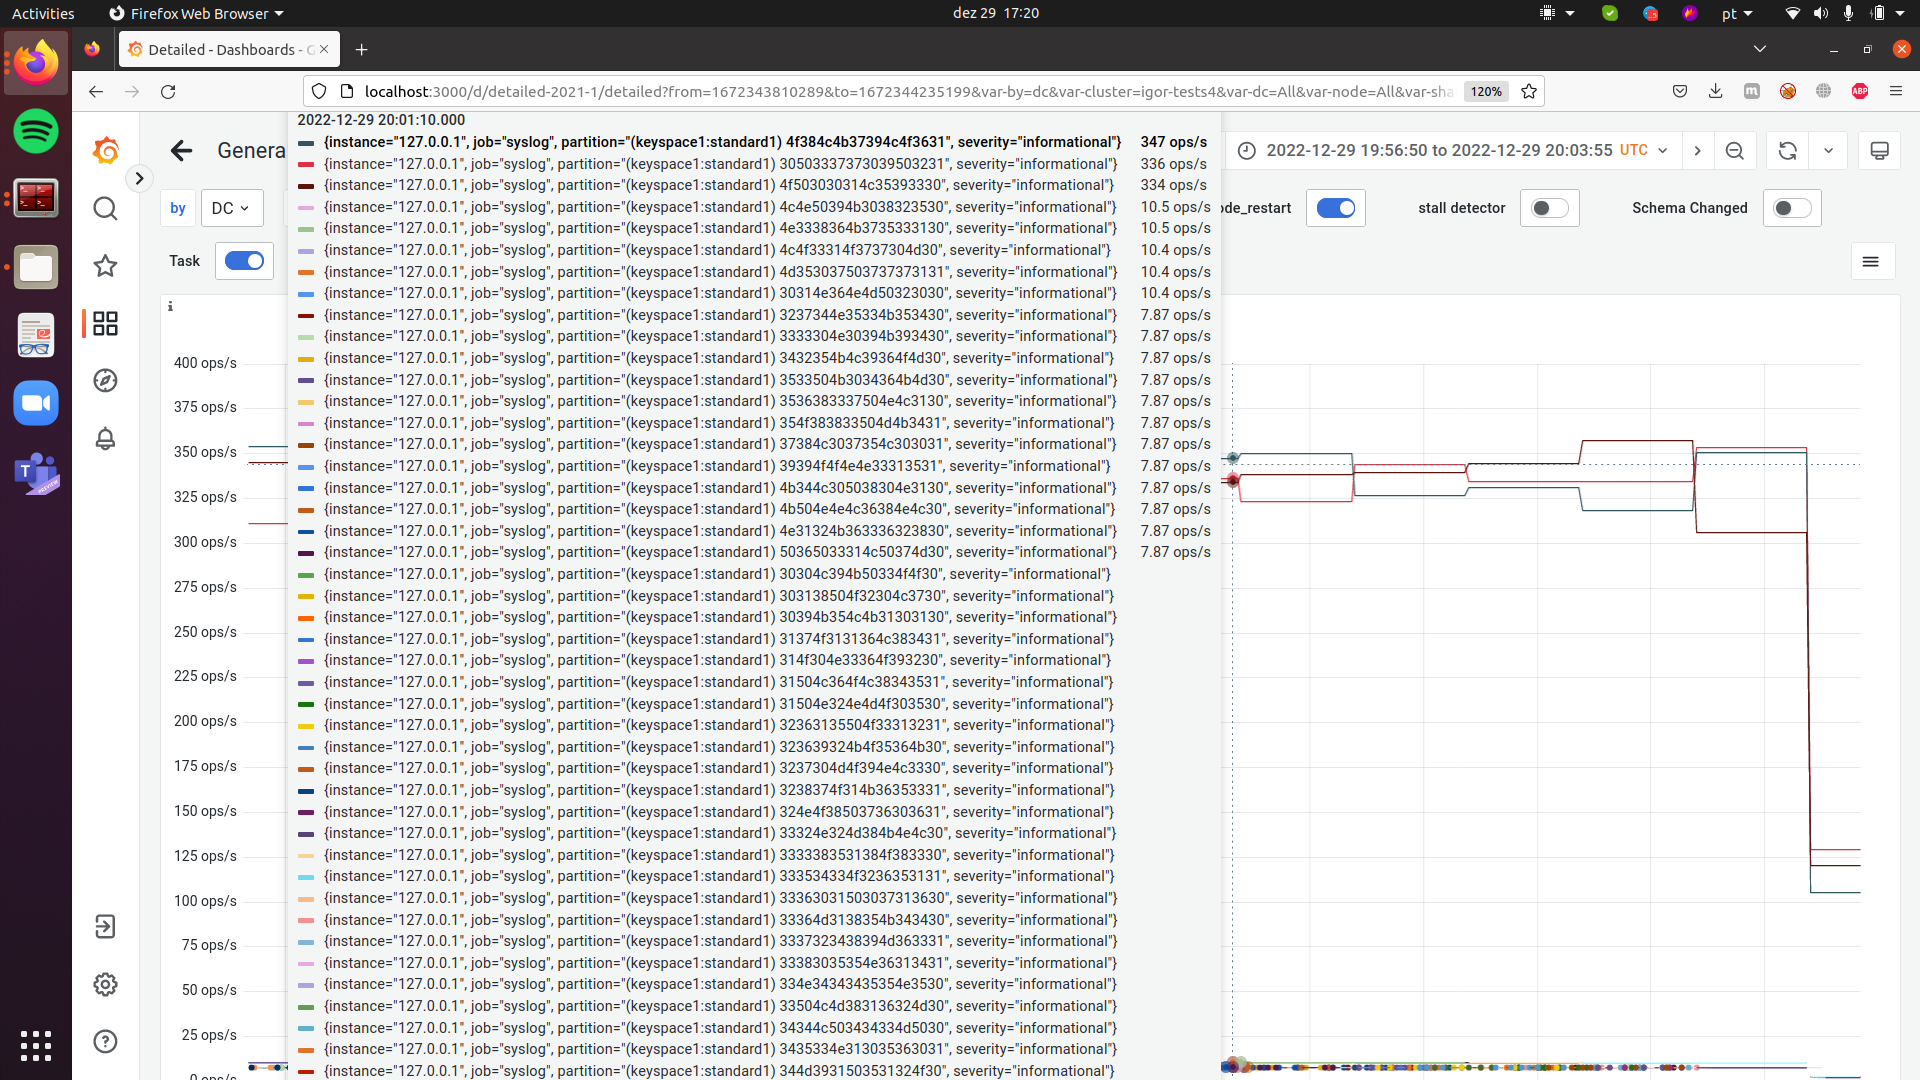
Here you see how we display toppartition data when we bash 3 partitions with a total rate of 1K OPS using one c-s instance and run another c-s instance that writes to a wide partition range sequentially.
We can see a "weird" value for partitions different from the "top 3" but this is because of "feature" of our toppartition API: for a partition that is written only once it shows the following funny output:
# nodetool toppartitions
WRITES Sampler:
  Cardinality: ~256 (256 capacity)
  Top 10 partitions:
	Partition                                      Count       +/-
	(keyspace1:standard1) 4f384c4b37394c4f3631      1806        26
	(keyspace1:standard1) 4f503030314c35393330      1651         0
	(keyspace1:standard1) 30503337373039503231      1628        26
	(keyspace1:standard1) 4d4e32383037504e3230        52        51
	(keyspace1:standard1) 384b344c3030324e3630        51        50
	(keyspace1:standard1) 31393638364b4e354b30        40        39
	(keyspace1:standard1) 374c374d4d364f4d3531        40        39
	(keyspace1:standard1) 304d363933394e303431        40        39
	(keyspace1:standard1) 50324f4c363330354f30        40        39
	(keyspace1:standard1) 38324c4c314e50383930        40        39

READS Sampler:
  Cardinality: ~0 (256 capacity)
  Top 10 partitions:
	Nothing recorded during sampling period...
So, there is nothing we can do on the Monitoring side about it right now. ;)
Great job, @igorribeiroduarte!
Now all we need is to add the missing "top X" metrics in Scylla as requested in the opening message.
I believe this is going to be a game changer!