clojisr
 clojisr copied to clipboard
svg-plot issues
The histogram plot example in https://scicloj.github.io/clojisr/doc/clojisr/v1/tutorial-test/#data-visualization fails to work when using svg export:
(plot->svg
       (hist [1 1 1 1 2 3 4 5]
             :main "Histogram"
             :xlab "data: [1 1 1 1 2 3 4 5]")
     :width 8
     :height 4)
It exports svg syntax, but it has no visible content:
"<?xml version=\"1.0\" encoding=\"UTF-8\"?>\n<svg xmlns=\"http://www.w3.org/2000/svg\" xmlns:xlink=\"http://www.w3.org/1999/xlink\" width=\"576pt\" height=\"288pt\" viewBox=\"0 0 576 288\" version=\"1.1\">\n<g id=\"surface91\">\n</g>\n</svg>\n"
With the anonymous function added svg renderer does work though. I really have no idea why that is. the hist functin returns 100% the same data as the anonymous function.
 (plot->svg
     (fn []
       (hist [1 1 1 1 2 3 4 5]
             :main "Histogram"
             :xlab "data: [1 1 1 1 2 3 4 5]")))
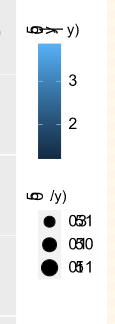
the other issue is that my generated svg files seem not to contain any text in the axes.
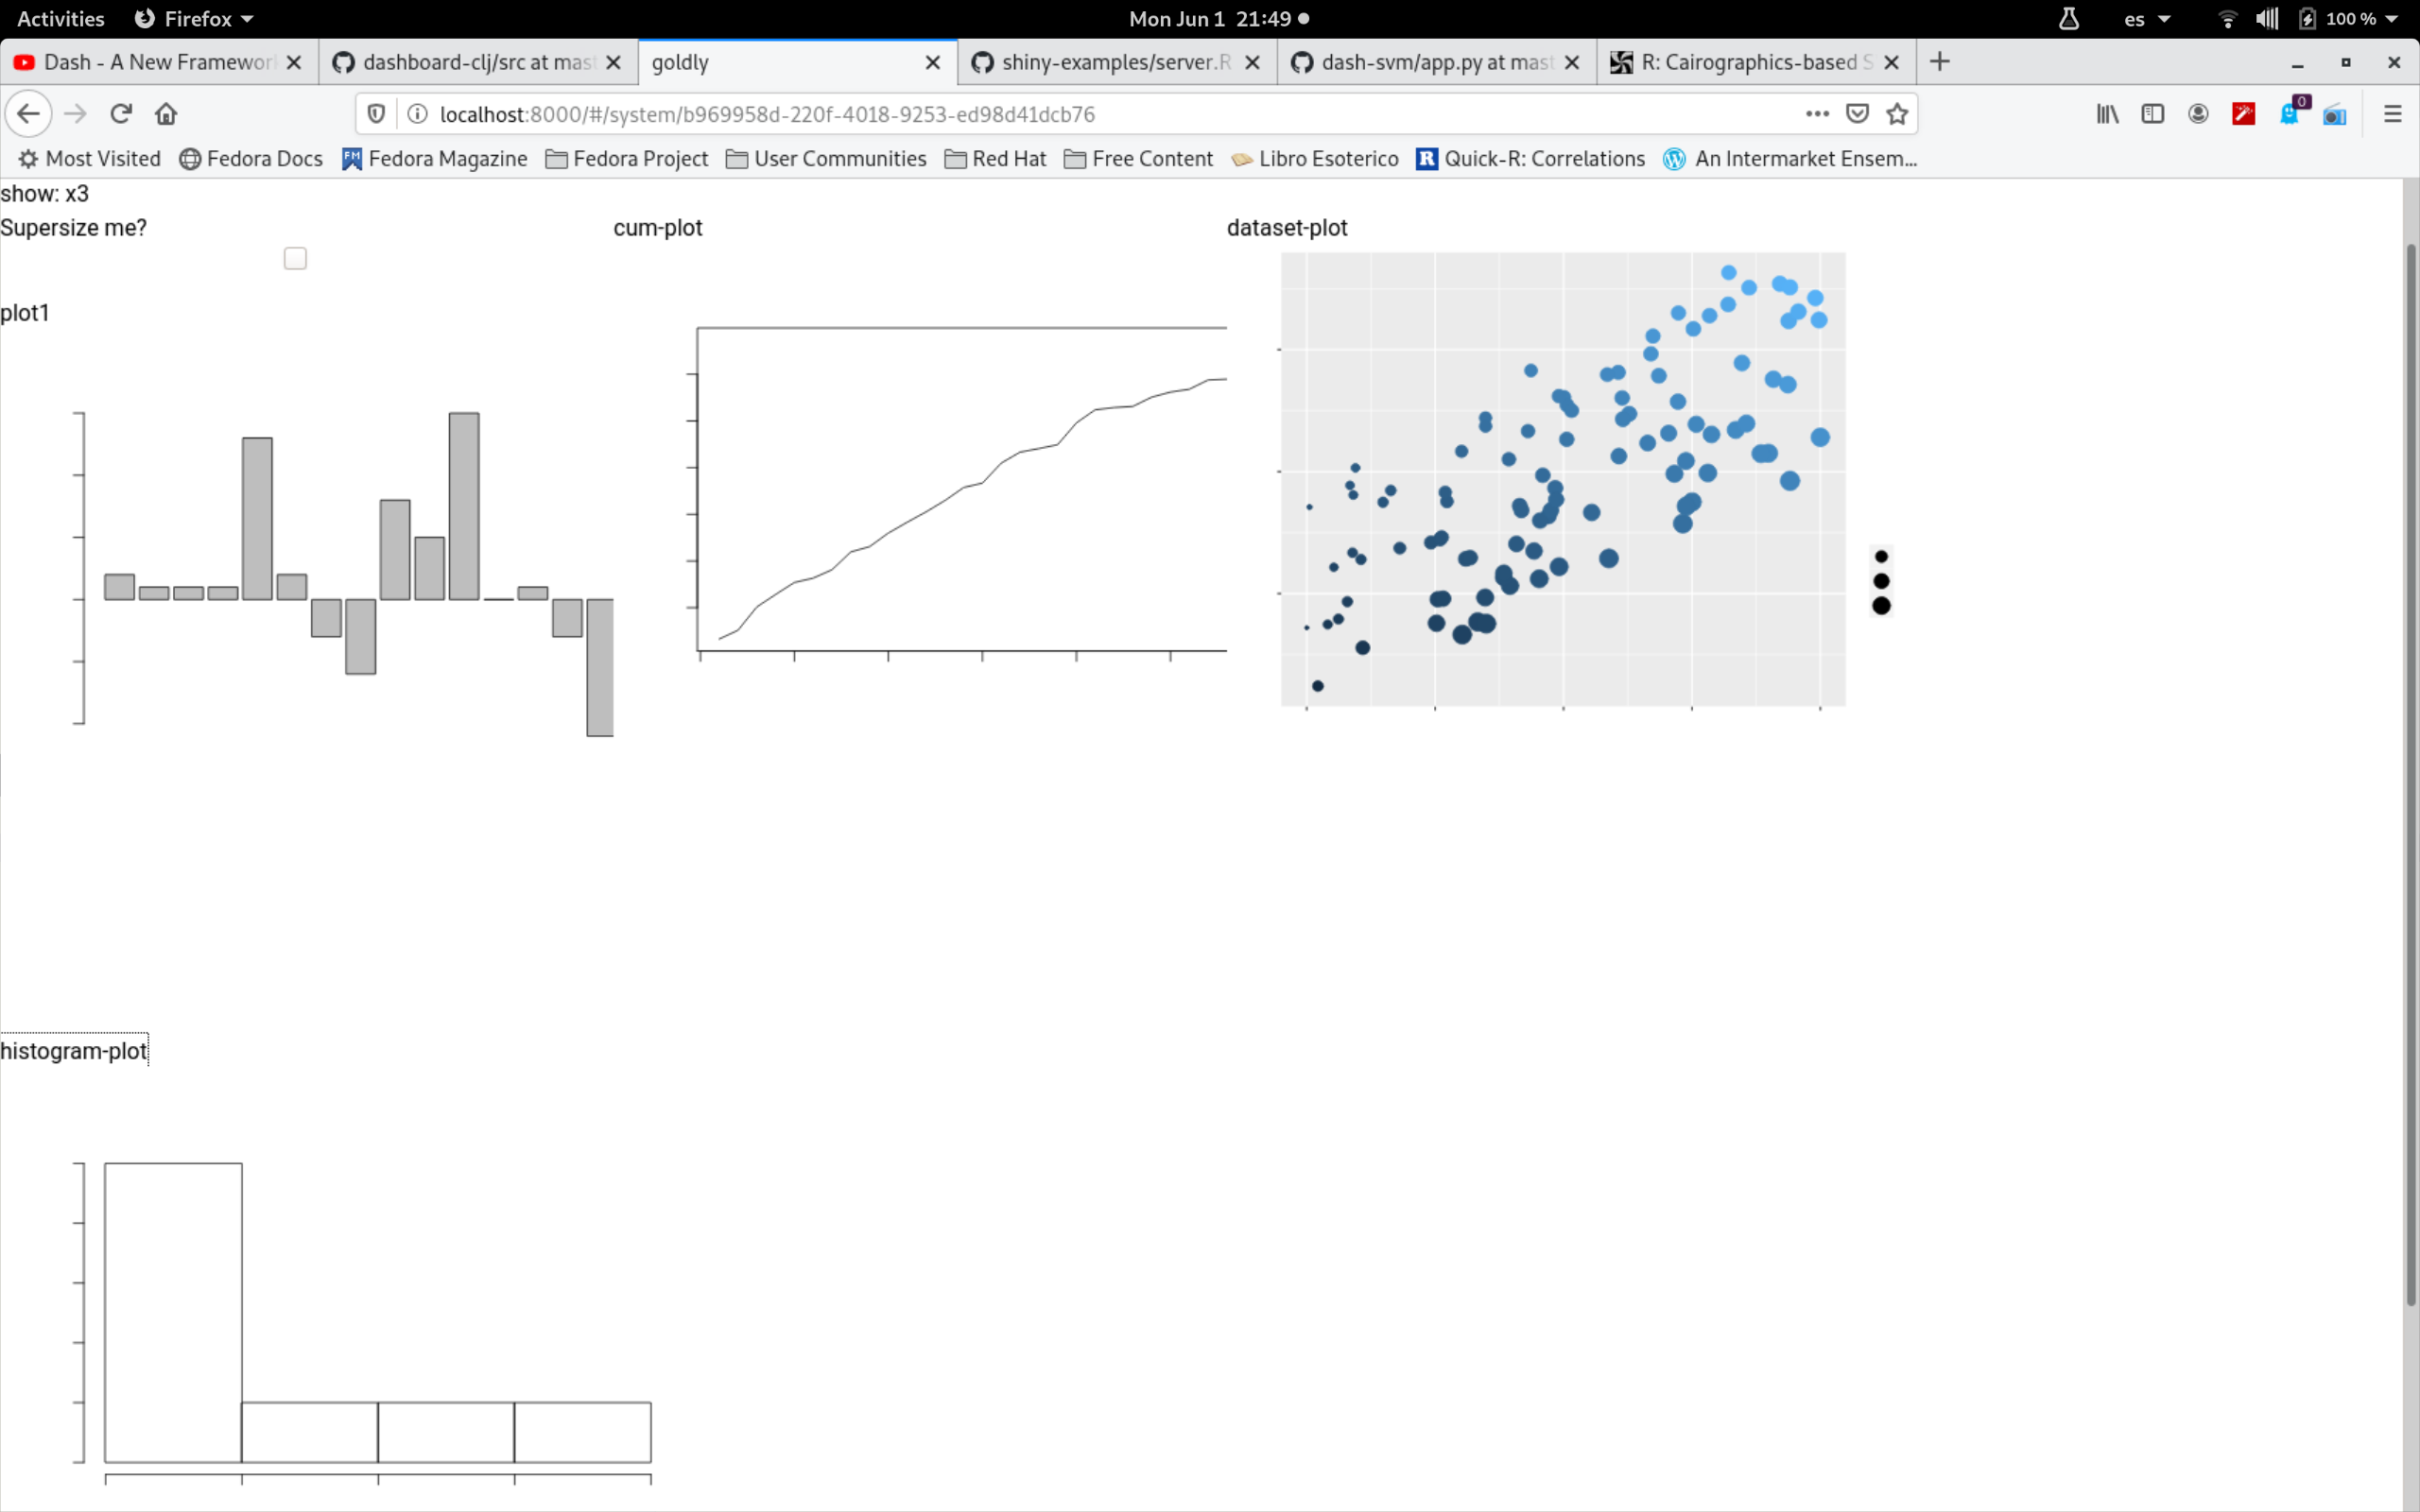
Last problem with plots is, that they look weird with svg. Even one of your demo notebook plots looks strange. This plots really should just need no parameters at all, and for fine tuning width(with height being determined by aspect ratio.
There are certain number of issues here.
-
Wrapping into function. As I answered here, this is how R plotting works. You have to know which method works which way:
graphicsbased functions have to be called within graphical context, which is created insideplot->...functions. So when you call(plot->svg (hist ...)), firsthistis called outside desired context and draws into the created adhoc pdf file. So wrapping into the function is a must here since you can't control side effects. Result ofhistincludes some statistics only.gridbased functions,ggplot2for example, create intermediate objects which do drawing when are printed (vieprintR function). So drawing is delayed this way and you can control side effects.
-
SVG generated by R is a crap... labels are missing or text is scrambled when used two SVGs in the same html, we have to switch to the
svglitepackage, but this requires package installation...
- We don't control svg generation on the R side. We just create SVG device, pass all parameters and return svg as string at the end. We add nothing here. https://stat.ethz.ch/R-manual/R-devel/library/grDevices/html/cairo.html
Maybe there is something wrong with escaping certain characters when converting to a String on Clojure side? What we do we slurp generated SVG by R and pass it to the user as a string.
Ok, looks like the same svg embedded in html renders bad but when opened just svg in a browser everything is render properly. Any idea what is going there? Maybe some CSS ruins rendering?
@awb99 I found the reason - every SVG generated by R contains defs section with definition of glyphs under the same names. And when you put two different SVG files in the same HTML they interfer each other and improper glyphs are used. I don't have any idea how to fix it.
@awb99 I found the reason - every SVG generated by R contains
defssection with definition of glyphs under the same names. And when you put two different SVG files in the same HTML they interfer each other and improper glyphs are used. I don't have any idea how to fix it.
This is not the case using package svglite. I tried it on the tutorials and it works nicely. Should we consider 2 switch to the svglite device for svg ? (which needed to be installed)