scala-dev
 scala-dev copied to clipboard
Reduce allocations of AsSeenFromMap / FindMember / SubstSymMap

It might be worth having a one-element cache in Global for each of these. We'd need to make them reusable (ie, the fields become vars and we add a reset method to assign new values).
The code in these can re-enter, at least through lazy type completers, so we either need to keep a stack of reusable ones, or simply just allocate for the re-entrant cases.
Here's what I've got in mind. https://github.com/scala/scala/compare/9766d5d400d71e53615a66016e7899ddd1086c8d...retronym:faster/one-elem-cache
I've taken a look at what would be needed to have the VM do this for us, with inlining and escape analysis.
One can use JITWatch:
object Test {
  val g = new scala.tools.nsc.Global(new scala.tools.nsc.Settings)
  g.settings.usejavacp.value = true
  import g._

  def main(args: Array[String])	{
    new Run()
    while (true) {
      test()
    }
  }

  def test() {
    typeOf[String].members
    typeOf[String].member(TermName("charAt"))
    typeOf[String].hasNonPrivateMember(TermName("charAt"))
  }
}
% qscalac sandbox/test.scala
% (qscala -J-XX:+UnlockDiagnosticVMOptions -J-XX:+TraceClassLoading -J-XX:+LogCompilation -J-XX:LogFile=/tmp/hotspot.log -J-XX:+PrintAssembly Test 2>&1) > /tmp/all.log

% cd /code; git clone jitwatch/jitwatch; cd jitwatch
% export MAVEN_OPTS="-Xmx4G"
% mvn clean compile test exec:java
- Configure JitWatch with the location of the Scala sources and binaries:

- Open Log
/tmp/hotspot.log - Start
- Navigate to
scala.reflect.internal.Types$Type/findMember
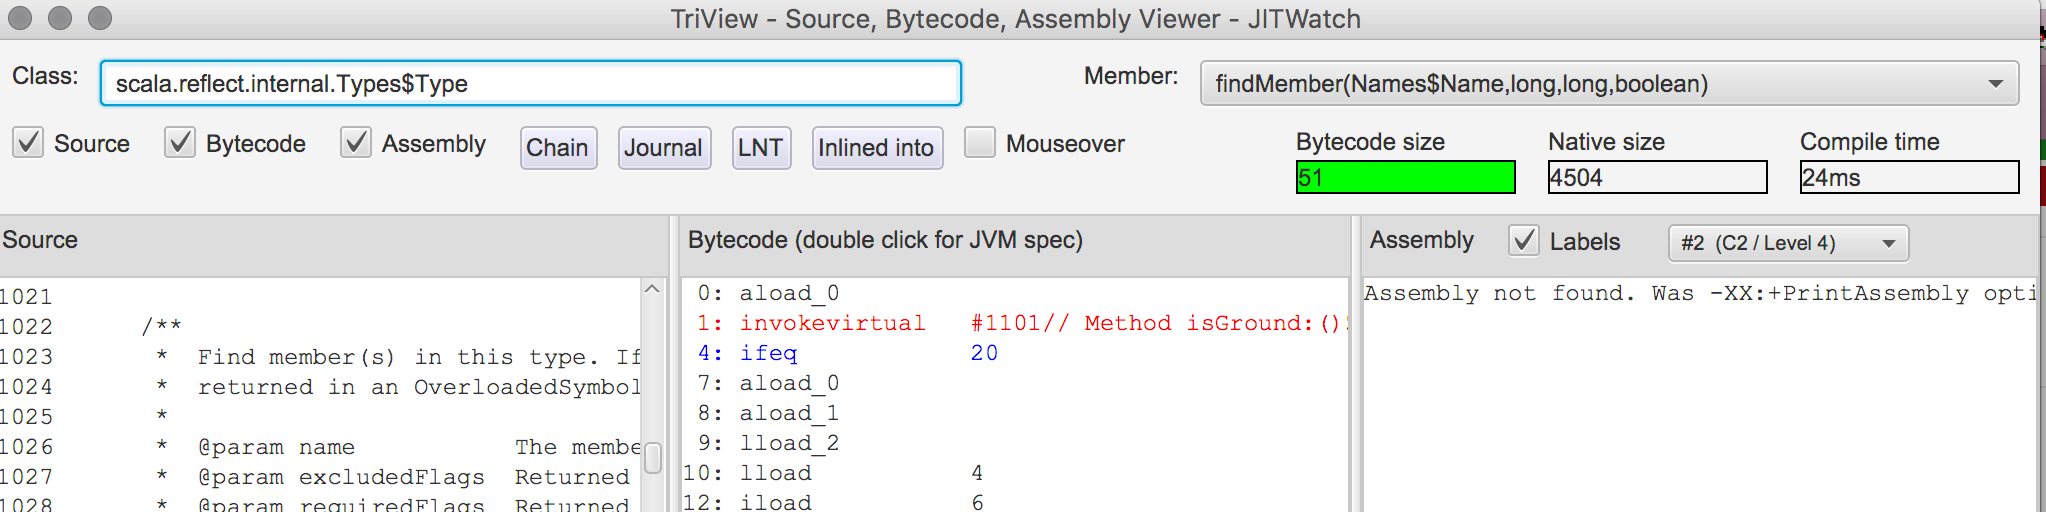
- 'Chain'
For escape analysis to kick in, we need FindMember.{<init>, apply, searchConcreteThenDeferred, walkBaseClasses, etc} all to inline, so that the FindMember instance doesn't escape outside the inlined unit of code.
With default VM options, we find this doesn't happen. Typically the reason in "already compiled into a big method".

This means that a helper method within FindMember had previously been chosen as the root of a JIT compilation task, and ended up with native code that exceeds a threshold in the JIT policy which prevents it from also being inlined into the call-tree that is the focus of the current JIT compilation task.
We can force inlining with a compiler control hint:
scala -J-XX:CompileCommand='inline scala.reflect.internal.tpe.FindMembers$FindMemberBase::*' ...
In which case we eventually can see escape analysis kick in:
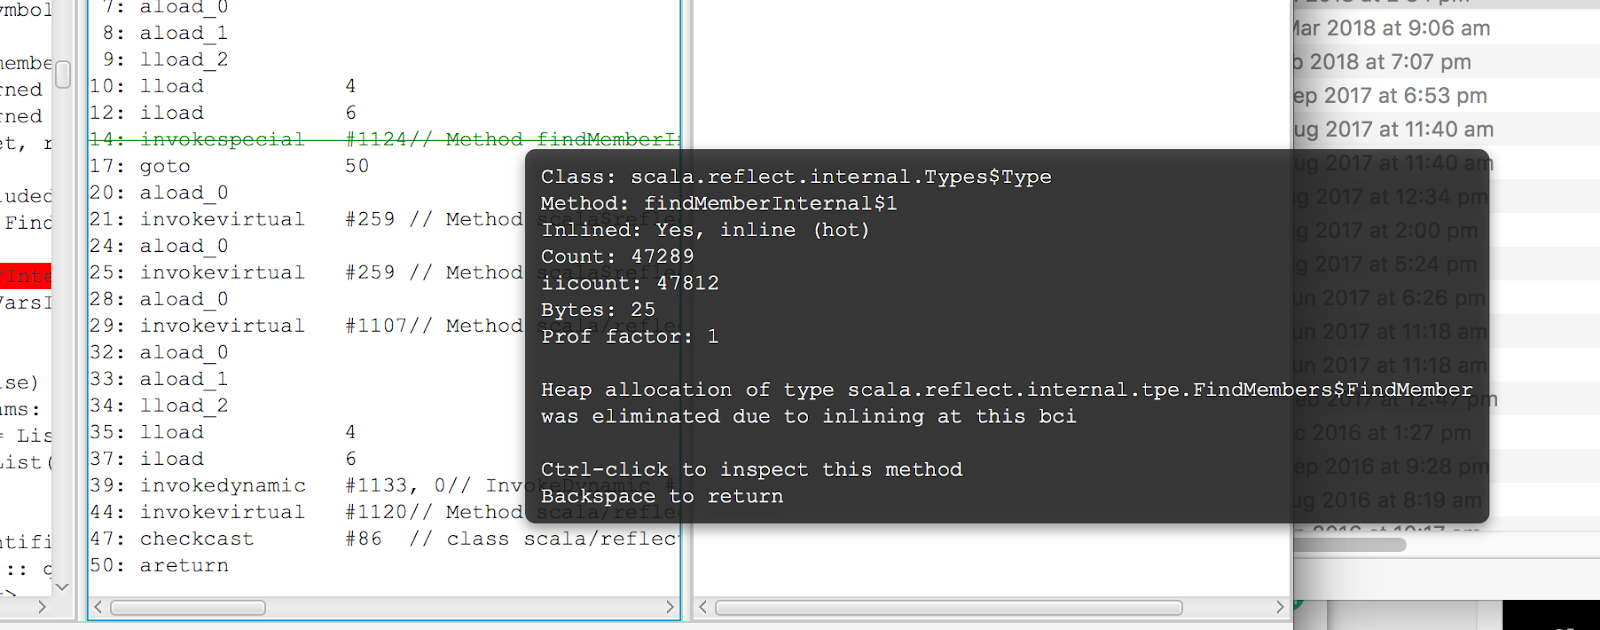
(The -Allocs button in the JITWatch GUI shows all successfully eliminated allocations found in the compilation log.
Graal EE does a bit better at getting inlining some, but not all of these instances. Currently, HotSpot's profiling doesn't gather data about how much an allocation site contributes to the allocation rate of short lived objects. If it did, Graal could conceivably try harder to inline the allocation away.
I feel like I've seen PRs and 2.12/2.13 differences around this (from @diesalbla and @hrhino's handiwork?). Is this done / happy to close it now?
@dwijnand So, here are some Pull Requests done to reduce the number of objects created:
- https://github.com/scala/scala/pull/6592
- https://github.com/scala/scala/pull/8681
- https://github.com/scala/scala/pull/8468
- https://github.com/scala/scala/pull/8306
- https://github.com/scala/scala/pull/8487
One last open Pull Request, https://github.com/scala/scala/pull/9039, should further reduce the number of SubstSymMap instances created, by reusing mutable ones.