ImplicitPlots.jl
 ImplicitPlots.jl copied to clipboard
implicit_plot! overrides plot setup
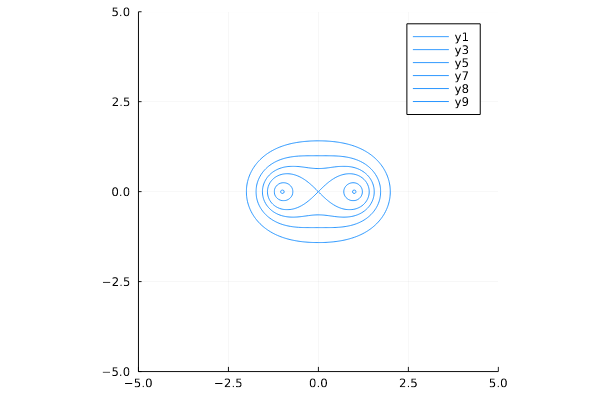
I've tried this in Pluto to interactively plot Cassinian ovals
begin
using ImplicitPlots
using Plots
end
let
a = 1
plt = plot(; xlims=(-2.5, 2.5), ylims=(-2.5, 2.5))
for b in (0.1, 0.5, 1, √2, 2, 3)
    f(x, y) = ((x-a)^2 + y^2)*((x+a)^2 + y^2) - b^2
    implicit_plot!(f)
end
plt
end
It seems like implicit_plot overrides lims defined by first plt = plot(; ...) call, so I have to setup the limits after the cycle. A bit annoying behavior. Should implicit_plot work with plot-related arguments as plot does, e.g. no implicit override?
Agree that the limits should not be overwritten.
We define the limits here: https://github.com/saschatimme/ImplicitPlots.jl/blob/d6473bbb6e048b7ca7b41290449bbc68ca479fba/src/ImplicitPlots.jl#L51-L52
The plots recipes state (https://docs.juliaplots.org/latest/recipes/)
The special operator --> turns linecolor --> :blue into get!(plotattributes, :linecolor, :blue), setting the attribute only when it doesn't already exist. (Tip: Wrap the right hand side in parentheses for complex expressions.)
So I don't know what I am doing wrong here...