prometheus_flask_exporter
 prometheus_flask_exporter copied to clipboard
Prometheus exporter for Flask applications

I am using PrometheusMetrics (prometheus_flask_exporter) with flask (see code snippet below) to generate gauge type metrics, but its (gauge) value doesn't appear to increase when seen from /metric Prometheus endpoint...
Is it only here or flask_http_request_total does not gather url path labels? How can I enable it? 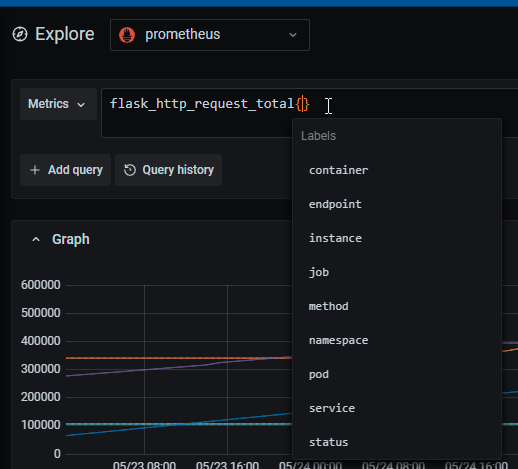
Hi, I want to add this metric that represents the age of files my application is working with. For that I just stat the known file and substract from `time.time()`...
Referring to this example `examples/sample-signals/app/app.py`, the metrics of all endpoints are exposed but I want to get metrics of child functions also, like def wait(): time.sleep(random.random() * 0.6) @app.route('/three') def...
Is this needed to be implemented in gunicorn config file? `` def when_ready(server): GunicornPrometheusMetrics.start_http_server_when_ready(8080) `` I am getting duplication port error. My config file looks like ` from consul_integration import...
I think making metrics of every arbitrary URL is not good for the server memory and prometheus scraping. So far, I made the following workaround to skip making metrics of...
I have a Connexion app which runs by `flask run` directly in the dev env, and with gunicorn in the production env, so I can't directly use `ConnexionPrometheusMetrics`. I made...
Hi There, Maybe I am doing something wrong in my configuration, but when I use Gunicorn to expose the metrics on another http server/port taken from the example config: GunicornPrometheusMetrics.start_http_server_when_ready(5005)...
Hello can you tell me grafana formula for your dashboard to check all requests over 100mc?
Is it possible to upload the sample grafana dashboard to central place https://grafana.com/grafana/dashboards? Then it is easy for end-user to try it just type `dashboard id`. To me, it is...