Provide a tool to see what user code is causing rustc to use lots of time
We should have a way to calculate how long each item in your codebase takes to compile. Conceptually this would work by grouping the measureme data by DefId/NodeId or some other identifier rather than by the query name. We can then output a sorted list of items by how long each takes.
For example, the output might look like this:
$ summarize code-profile /path/to/rustc-results

Total time in rustc: 120 seconds

----------------------------------------
| % time | Item                        |
| ------ | -----------------------------
| 20.4%  | example::foo::bar::clone()  |
| 10.2%  | example::baz::widget::bla() |

(more rows)
This will require changes to the profiling code in rustc to record DefIds or NodeIds for each query.
Some more notes here: Once we record query-keys and function parameters we basically have the whole query graph in our trace. That lets us do some quite sophisticated analysis. However, there are also some limitations:
- A big part of compilation is spent in LLVM and (at least right now) we can only measure things a the codegen-unit level. That means we know how long it takes to optimize the whole object file but we can't tell how that time is divided up between the individual functions in there. But maybe LLVM has some facilities to get more information.
- Because query results are cached, it can be tricky to attribute compile time to a single function. E.g. if both function
foo()and functionbar()trigger computing the type info for structFoothen where do you count the time it took to computeFoo's type info? - On the other hand, given the query graph it is easy to find things that have been triggered by only one function and one could also do a "simulation/approximation" of what compile times would look like if a given function would be deleted from the code base. (At least for the single-threaded case)
Some thoughts from an outsider, worth exactly what you paid for.
A big part of compilation is spent in LLVM
I would ges that llvm-ir is a pretty good measure of proportion of time. So a tool to tell me, for each line of code in some file, how much llvm-ir is transitively generated, soudes very useful. I also think this may make it possible for non-rustc devs to find https://github.com/rust-lang/rust/pull/64572 by saying "why is iter.all taking 1/2 of my generated llvm-ir?"
Because query results are cached, it can be tricky to attribute compile time to a single function.
I think there are 2 answers to this that may be worth looking at. One is averaged out (time to compute cached results)/(number of times it is used). This is useful for aggregating, as it sums up to the real total time. The other is double count, anything that uses a cached result gets the full charge time to compute the result. The sum does not make sense, but it helps make it clear what is expensive to compile.
"simulation/approximation"
The coz profiler tries to get an estimate of if "I speed up this part by x% how much with the total process get faster?". I have never used it, but it sounds interesting.
Carrying over some discussion from the forums, I agree with you @wesleywiser that it's a tricky question here and we can erroneously blame the wrong code, but I also agree with @Eh2406 that the sums may not end up mattering too much in practice.
For the problem you brought up in the forums, I'd actually expect that layout_of(Vec<u8>) -> TyLayout would get "blamed" to Vec itself rather than whomever requested Vec. It may be a little harder at that point to go through and actually figure out who requested Vec<u8> so much, but that's actually a lot better than what we have today anyway :)
An example of what I'd love to get from this is that I recently changed the jobserver crate to stop using std::sync::mpsc for synchronization, and instead use Mutex and Condvar. That shaved about 33% of the crate's compile time because std::sync::mpsc brings in so much code to monomorphize.
For this sort of question ("what in my code is taking so long to compile") I don't think we necessarily need precise and 100% accurate information, just seeing a huge amount of stuff pointing at std::sync::mpsc would have been a great head start in tracking things down.
Another example for this is the discovery of https://github.com/rust-lang/rust/issues/64140 which only really happened by accident. But I had no idea that using Command was bringing in thousands of lines of IR, so some sort of "blame" tool, even if it was pretty coarse, would have set off the alarms of where to start looking.
I was discussing this a bit with @michaelwoerister. My main thought here, which perhaps backs up @alexcrichton's point:
I think a common problem is excessive generics creation. It'd be great if we could measure the amount of LLVM code generated by various bits of your rustc source. I'm not sure if the self-profile tool can be adapted to this or not, it's obviously a bit beyond the original spec of measuring runtime. I suppose that being able to list all the things instantiated within a CGU (by size) would also be a decent tool, since then you could say "ah I see that optimizing this CGU is taking a long time, what's in there?" and that might guide you to the problem.
Actually one thing that I think would be really cool is to have a diagram like this..
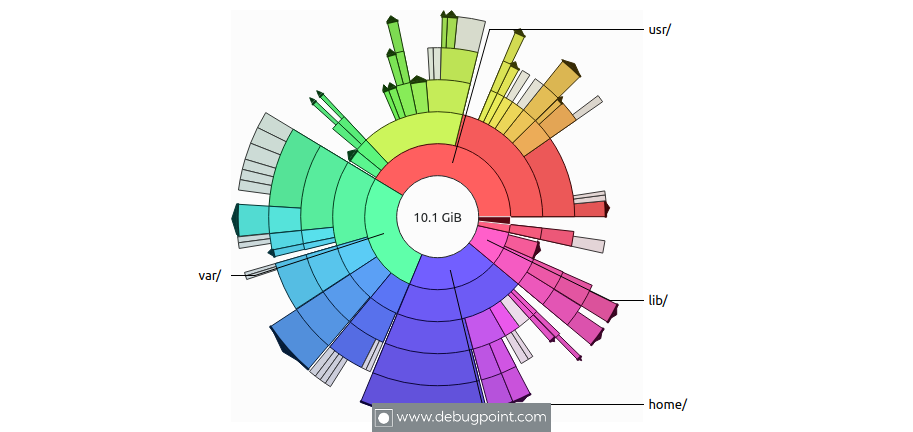
for LLVM IR. The first ring around the center could be crate, and then each layer deeper could be a module, eventually getting to individual functions. I feel like that alone would be very informative to just say "oh wow serde is 90% of my crate?!" and going from there.
Now it's true though that the amount of LLVM code is only a proxy for the number we care about, compile time, so it's not perfect.
Sunbursts have the disadvantage that your eye sees the area of a section, but the angle is what actually matters, so sections at outside look bigger than sections near the center. I prefer flamegraphs.
The first ring around the center could be crate, and then each layer deeper could be a module, eventually getting to individual functions.
+1
It'd be great if we could measure the amount of LLVM code generated by various bits of your rustc source
Huh, we could even record events in the monomorphization collector and CGU partitioner and then one could know exactly where instantiation happens.
Looks like clang just got a similar feature https://www.snsystems.com/technology/tech-blog/clang-time-trace-feature
I was hacking in the llvm support in rustc yesterday to see what was possible to see but I do not know if chrome tracing was best format, also it was only possible to use -C codegen-units=1 due to the llvm code was not threadsafe. but it was fun to see some info of where the time was spent in llvm per function
Nice! This looks like it should be able to provide the information we want. @andjo403, there's also -Z no-parallel-llvm which should help with the thread safety problem too. It's a shame that the tooling doesn't seem to be thread safe though.
have made an POC with adding the clang time-trace feature in the self-profiling but do not know if it is something that can be up streamed can find the code here https://github.com/andjo403/rust/tree/llvmProfiler
@andjo403 Cool. We'll probably come back to this some time later this year.
I think it'd be great to figure out a way to integrate any work here with cargo's -Z timings feature. I tried that out on a crate of mine and noticed that one of my sub-crates spends a lot of time compiling before codegen. It'd be great to be able to build with rustc profiling enabled so I could drill down in that graph to get an idea of where all that time is being spent.
I spent a number of hours yesterday removing parts of my codebase in an effort to track down a compile time increase.
A tool like this would save a massive amount of time, and make it easier for crate creators to make informed decisions.
I’d very much like to see progress made here!
I recently was told about cargo-llvm-lines. It tells you how many lines of LLVM IR is produced for each function/method, and how many times each function/method is instantiated. (The latter number can get surprisingly high for generic functions/methods.)
It's great. I've already used it for https://github.com/rust-lang/rust/pull/72013, https://github.com/rust-lang/rust/pull/72166, and https://github.com/rust-lang/rust/pull/72139. Although the number of lines of LLVM IR code is only a proxy for the time taken to compile the code, it's good enough in practice to give useful results. As Alex said above, rough information is much better than no information.