bigfive-web
 bigfive-web copied to clipboard
Start charts from minimum value
Per information visualization best practices (I'll look up a source if needed) the minimum possible value should be at the bottom of the chart if the maximum is at the top of the chart.
Since the questions receive 1 to 5 points each, the minimum value for
all charts on the site is max/5. Make it the default for BarChart and
BarChartCompare, and add the min prop for explicit configuration.
N.b. I haven't coded Vue before so feel free to point out any best practices I missed.
I'll note that the results would be easier to understand if the scale was [-2, -1, 0, 1, 2] instead of [1,2,3,4,5]. But I'm not sure it's a good idea to mess with the scoring specified in IPIP-NEO.
I'll note that the results would be easier to understand if the scale was [-2, -1, 0, 1, 2] instead of [1,2,3,4,5]. But I'm not sure it's a good idea to mess with the scoring specified in IPIP-NEO.
The scoring is 1 - 5 for all questions keyed + and 5 - 1 for all keyed - :-) But, yeah not a good idea to change that.
Sorry for the late reply.
I like the idea and PR, but there is an issue when displaying low scores
If we're going to change it, I think the right way to do it is to subtract by 4 of every facet in api/result.js ... i think.
Right, I see. I don't really consider not showing zero-height columns an issue; that's just what most column charts do. But if this is an issue, maybe it's best to let the user choose (interactively, site-wide) between raw and scaled scores.
The optimal scaling IMHO would be -100%..100%. Currently the neutral score for a single facet is 12, which must be unexpected to most people, and is not visible in the chart at all.
I'll see if I have time for a better PR later.
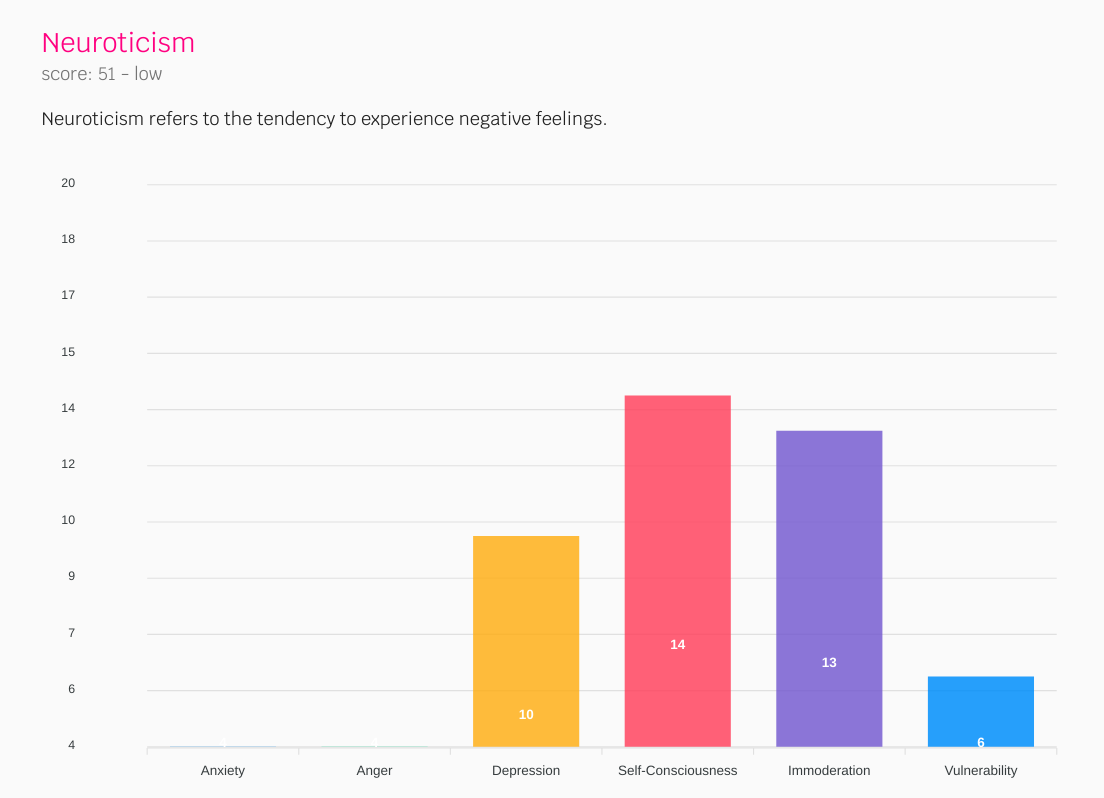
Anxiety and Anger shows the misplaced value in white text and the value of vulnerability is too low, but zero-height columns is OK by me.
Moving the labels above the column would probably help.
https://apexcharts.com/javascript-chart-demos/column-charts/column-with-data-labels/
I'd also make the tooltip work above the column like Highcharts does, but I'm not sure if Apexcharts supports that.
https://www.highcharts.com/demo/column-basic