rmarkdown
 rmarkdown copied to clipboard
Inconsistent figure size in RStudio IDE when running chunks in Notebook
I am not sure if this is the right place to submit this. There seems to be one annoying thing when chunk is generating figure in R markdown document. When chunk has specified figure size e.g. {r fig.width = 8, fig.height = 4} the actual size of a figure changes depends on the resolution of the computer screen. I have a mac with retina display and a secondary monitor with lower resolution, so when figure is generated on one screen it has different physical size then when the code is re-run on the second screen. I understand that the size is calculated based on dpi of the device, but this makes the code irreproducible. What I would imagine could help is if (on mac) the figure is always generated at retina (or 4K) dpi and when then the figure physical dimensions would be scaled down when the windows is dragged to low resolution screen.
R version 3.6.1 (2019-07-05) Platform: x86_64-apple-darwin15.6.0 (64-bit) Running under: macOS Mojave 10.14.6, RStudio 1.2.1335
Random number generation: RNG: Mersenne-Twister Normal: Inversion Sample: Rounding
Locale: en_US.UTF-8 / en_US.UTF-8 / en_US.UTF-8 / C / en_US.UTF-8 / en_US.UTF-8
Package version:
base64enc_0.1.3 digest_0.6.25 evaluate_0.14 glue_1.4.1 graphics_3.6.1 grDevices_3.6.1 highr_0.8 htmltools_0.4.0
jsonlite_1.6.1 knitr_1.28 magrittr_1.5 markdown_1.1 methods_3.6.1 mime_0.9 Rcpp_1.0.3 rlang_0.4.6
rmarkdown_2.1 stats_3.6.1 stringi_1.4.6 stringr_1.4.0 tinytex_0.23 tools_3.6.1 utils_3.6.1 xfun_0.14
yaml_2.2.1
Pandoc version: 2.3.1
By filing an issue to this repo, I promise that
- [x ] I have fully read the issue guide at https://yihui.org/issue/.
- [ x] I have provided the necessary information about my issue.
- If I'm asking a question, I have already asked it on Stack Overflow or RStudio Community, waited for at least 24 hours, and included a link to my question there.
- If I'm filing a bug report, I have included a minimal, self-contained, and reproducible example, and have also included
xfun::session_info('rmarkdown'). I have upgraded all my packages to their latest versions (e.g., R, RStudio, and R packages), and also tried the development version:remotes::install_github('rstudio/rmarkdown'). - If I have posted the same issue elsewhere, I have also mentioned it in this issue.
- [x ] I have learned the Github Markdown syntax, and formatted my issue correctly.
I understand that my issue may be closed if I don't fulfill my promises.
I don't think rmarkdown (or knitr under the hood) is intelligent enough to detect your screen resolution and change the figure size accordingly (to be honest, I don't know how to do that in R). So we need a reproducible example, and also screenshots to show the problem. Thanks!
BTW, you can actually check if the figure files generated on the two screens are identical by looking at the RMD_FILENAME__files/figure-html/foo-1.png files after you set the output format option self_contained: false. I bet they would be identical.
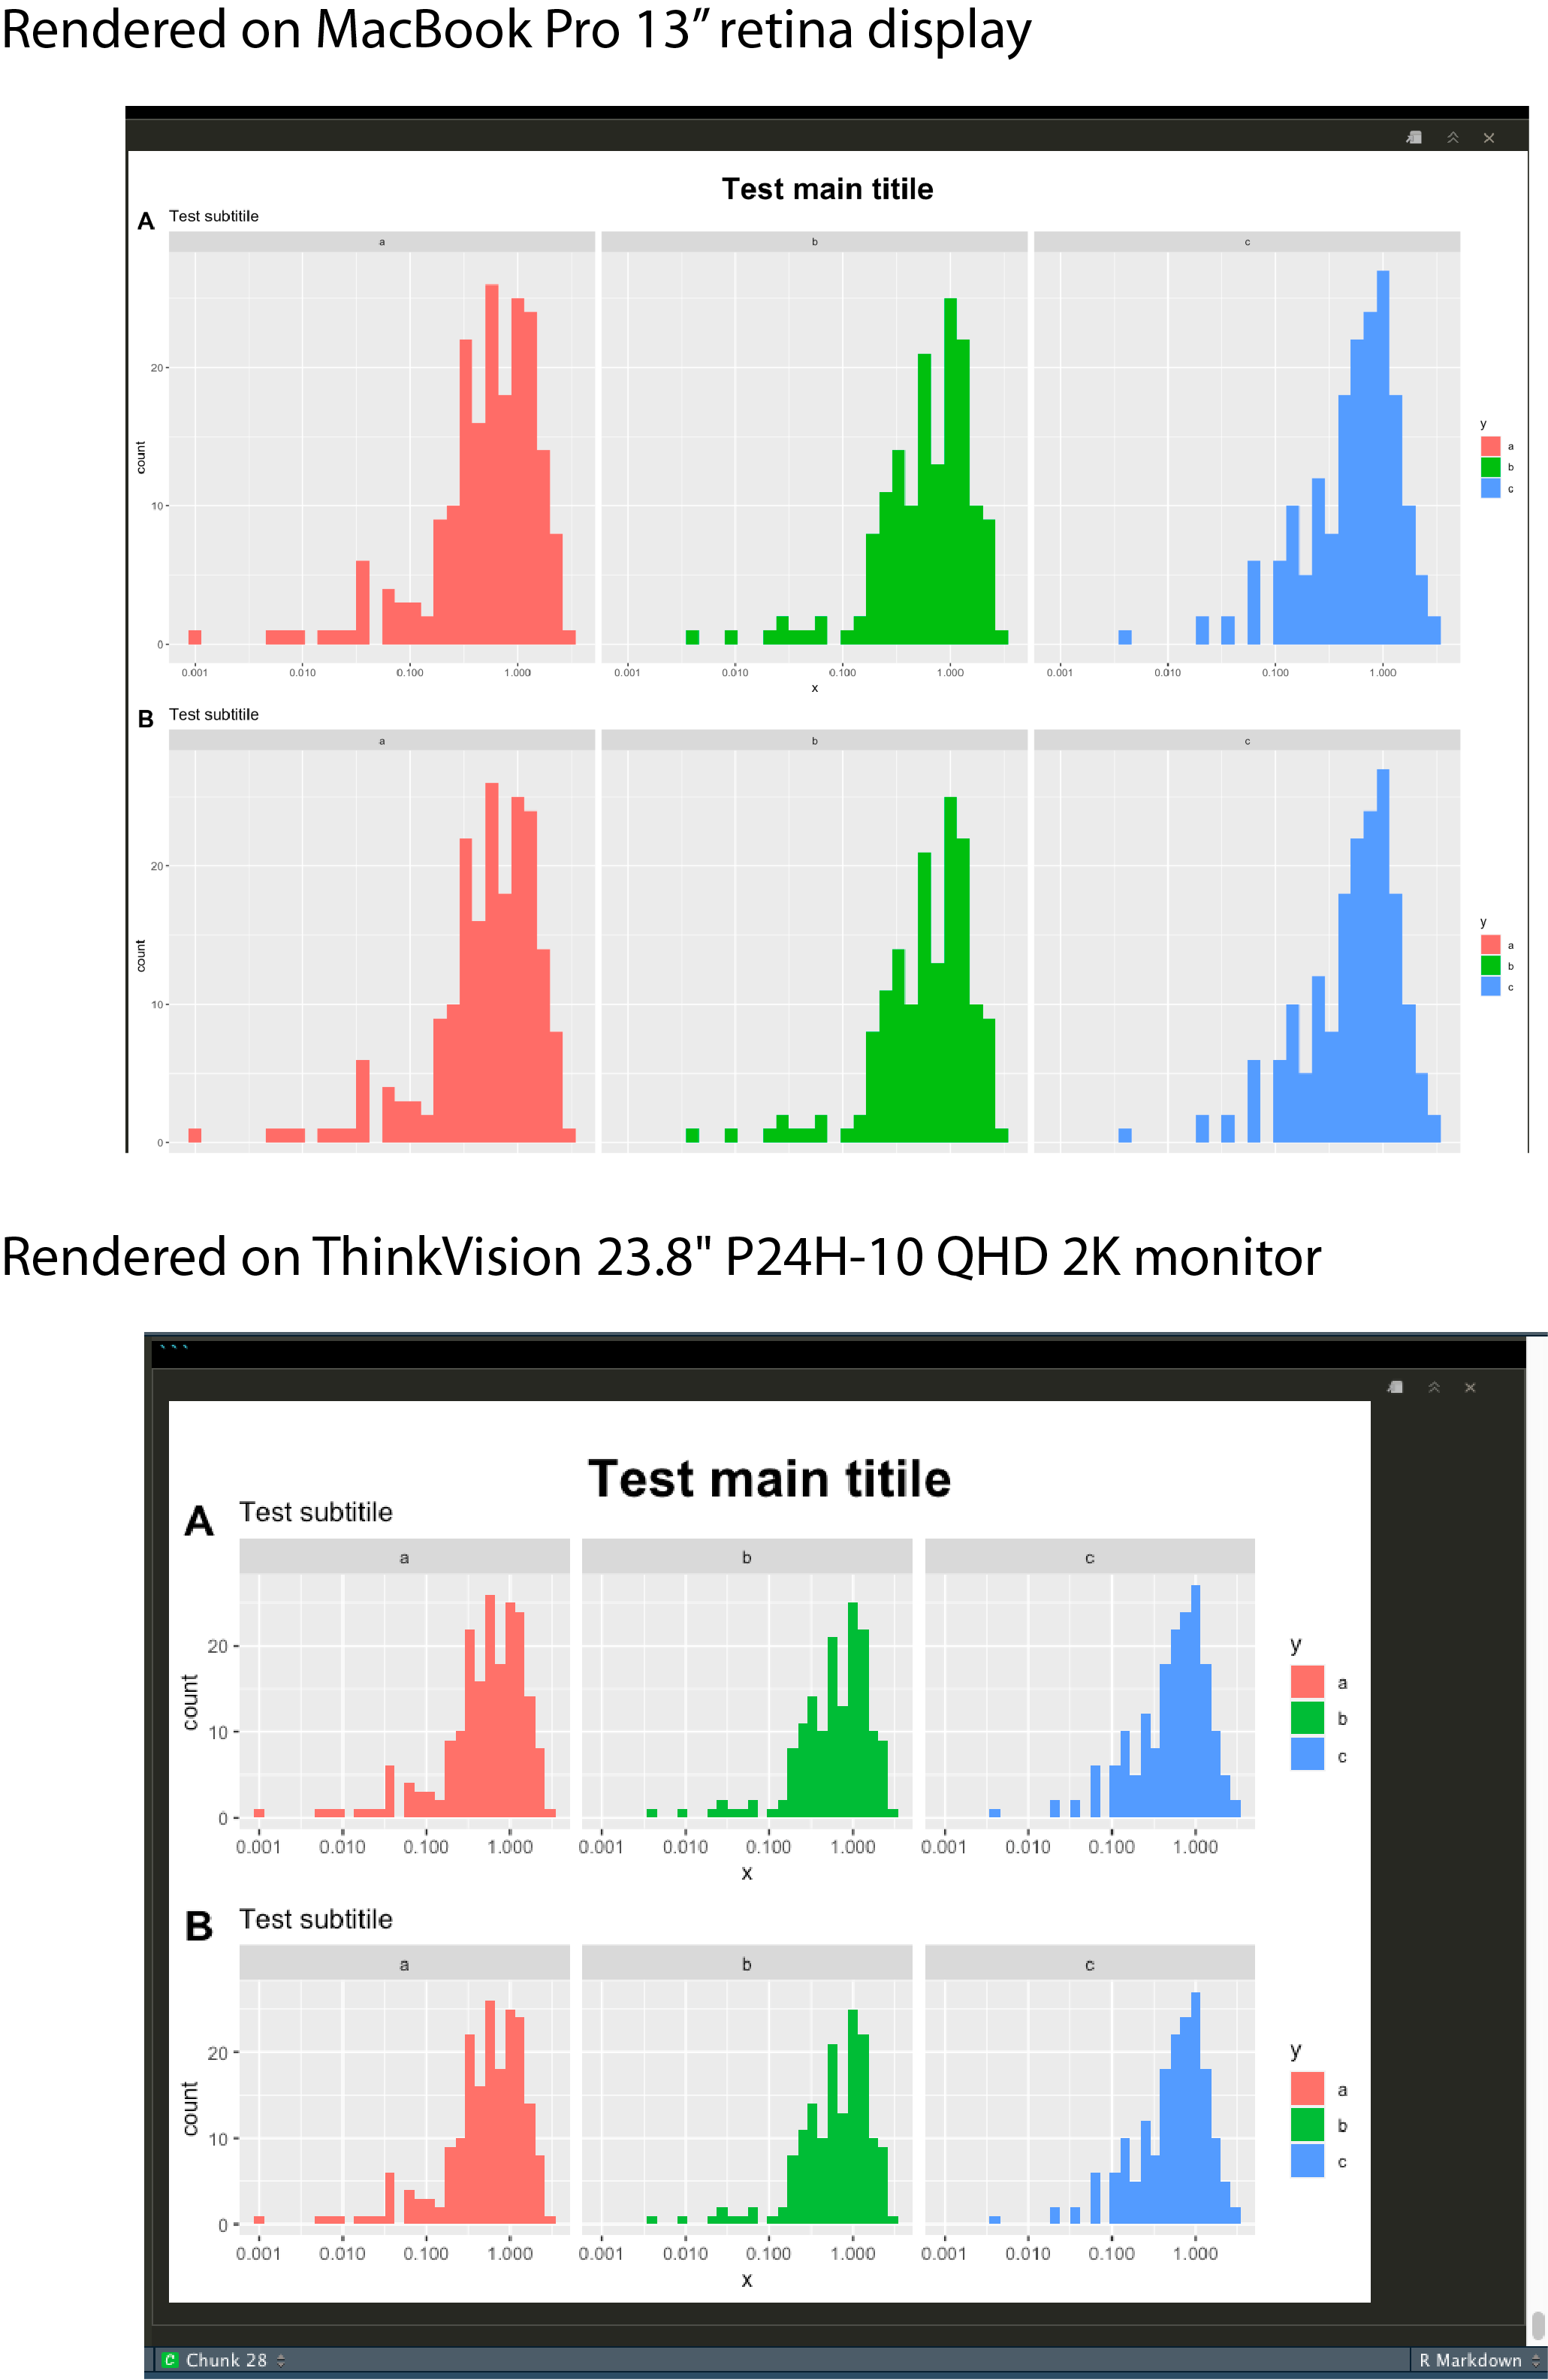
OK. So I tried to investigate this issue more and now I am not sure whether the problem is Rstudio, knitr or MacOS. What seems to be happening is that on Retina display all the text in the plot is rendered smaller and on the low-res screen bigger, which then interferes with plot dimensions. Particularly when there are a lot of labels in the plot. Another weird thing is that the different text size appears only when the Rstudio window is moved to the other monitor and the RStudio windows is slightly resized prior attempting to re-draw the plot.
Here is example of code and the output I am getting. I am using cowplot package to exaggerate the issue, but it happens when cowplot is deactivated as well:
```{r message=FALSE, warning=FALSE, fig.width = 8, fig.height = 6}
library(tidyverse)
library(cowplot)

data <- data.frame(x = rnorm(999), y = rep(c("a", "b", "c")))

p1 <- p2 <- data %>% ggplot() +
            geom_histogram(aes(x = x, fill = y)) +
            facet_wrap(vars(y)) +
            scale_x_log10() +
            labs(title = "Test subtitile")

plot_grid(p1, p1, labels = c("A", "B"), ncol = 1, label_size = 20) +
    draw_plot_label("Test main titile", size = 25, x = 0.5, y = 1.015, hjust = 0.5, vjust = 0.5) +
    theme(plot.margin = unit(c(1.5,0,0,0), "cm"))
Both plots are 1:1 screenshots:
I think the size of figures on RStudio IDE depend on dpi settings of displays. Also, even if within the same display, size of figures vary by the available frame size.
If you render the file to HTML or whatever, then you'll get identical results regardless of displays.
Yes, the scaling that you are showing is expected. But in my case, all the fonts and plot margins are completely off by a lot. Rendering to a file might be doing it correctly, but this inconsistency is quite annoying. Plus how would I know how my final html plot will look like if my preview keeps changing depending, which monitor I am currently working on. Not to mention if I would share the document with a collaborator and the plot on their screen looks differently.
It seems the appropriate place to post this is directly RStudio project then.
@Mashin6 sorry for the dealy on this. We are coming back to rmarkdown and I am triaging all the issue board.
Did you still encountered this behavior after new updates of RStudio and rmarkdown/knitr ? Maybe things have been improved.
Currently, I don't see where in knitr the code could calculate different size based on your monitor. So I would like to look into this closer but need help as I can't reproduce this easily.
BTW, you can actually check if the figure files generated on the two screens are identical by looking at the RMD_FILENAME__files/figure-html/foo-1.png files after you set the output format option self_contained: false. I bet they would be identical.
I am curious if you actually checked the figures files generated ? It would be interesting to share with us the two png files generated so that we can compare. magick package would be a good way to load the images in R and compare there settings. to see if files, dpi and other are same or not.
Also, does this behavior happen only within rmarkdown, within Rstudio IDE ?
What does happen in R console if you generate the file and save them to file ? using ggplot2::ggsave() for example.
By the way, what knitr does is using the grDevices::png() device by default to save to file. You could try another device to see if this change anything. like dev = "ragg_png" as knitr option or in the rmarkdown output format.
Anyway, we need access to more information on your side in order to be able to investigate further. thanks!
Regarding @EoinTravers comment on the RStudio IDE issue https://github.com/rstudio/rstudio/issues/7028#issuecomment-793713035, I did test the current behavior using this file
---
title: "Figure Problems"
output:
  html_document:
    fig_retina: 2
---

```{r plot, fig.width=4, fig.height=4}
knitr::opts_chunk$get('fig.retina')
plot(iris$Sepal.Length, iris$Sepal.Width)
```

```{r}
img <- magick::image_read(knitr::fig_chunk("plot", "png", 1))
magick::image_info(img)
```

```{r plot2, fig.width=4, fig.height=4, fig.retina = 1}
knitr::opts_chunk$get('fig.retina')
plot(iris$Sepal.Length, iris$Sepal.Width)
```

```{r}
img <- magick::image_read(knitr::fig_chunk("plot2", "png", 1))
magick::image_info(img)
```
fig.retina = 2(which is the default forhtml_document()fig.widthandfig.heightare set to 4 inches on both graph- I am setting
fig.retina = 1on the second graph. - The generated file is read with magick package to gets its informations.
- Default DPI for rmarkdown HTML format is 96 DPI
This is what I get

We can see that fig.retina is basically a DPI multiplier. Files will be the same dimension (4 x 4 inches) but file size will be bigger as DPI gets bigger
- First file
- 768 pixels x 768 pixels
- DPC 76 dots per cm ~ 192 DPI = 2 * 96 = (fig.retina * DPI)
- dimension = 768 pixels / 192 = 4 inches
- Second file
- 384 pixels
- DPC = 38 ~ 96 DPI = 1 * 96 = (fig.retina * DPI)
- dimension: 384 / 96 = 4 inches
We get the same dimensions but the density is different. I don't rmarkdown does anything specific to screen display here. This is just about image dimensions and configuration. You can set fig.retina = 1 and control size directly using option.
Having the files you are generating on your side can help see the difference and investigate. Thank you !
@cderv Thanks for looking into the issue. Few things:
- this issue still happens in RStudio 2021.09.01 Build 372 with R 4.1.2, knitr 1.37, rmarkdown 2.11 on 14'' M1 MacBook pro.
- it happens only when figure is generated by running a chunk in Rmd document in RStudio, but not when the code is run from normal document.
- It doesn't happen when figure size is set to auto or small numbers like
fig.width = 4, fig.height = 4, but starts happening with large figures e.g.fig.width = 8, fig.height = 6. - knitr html output figures are not affected.
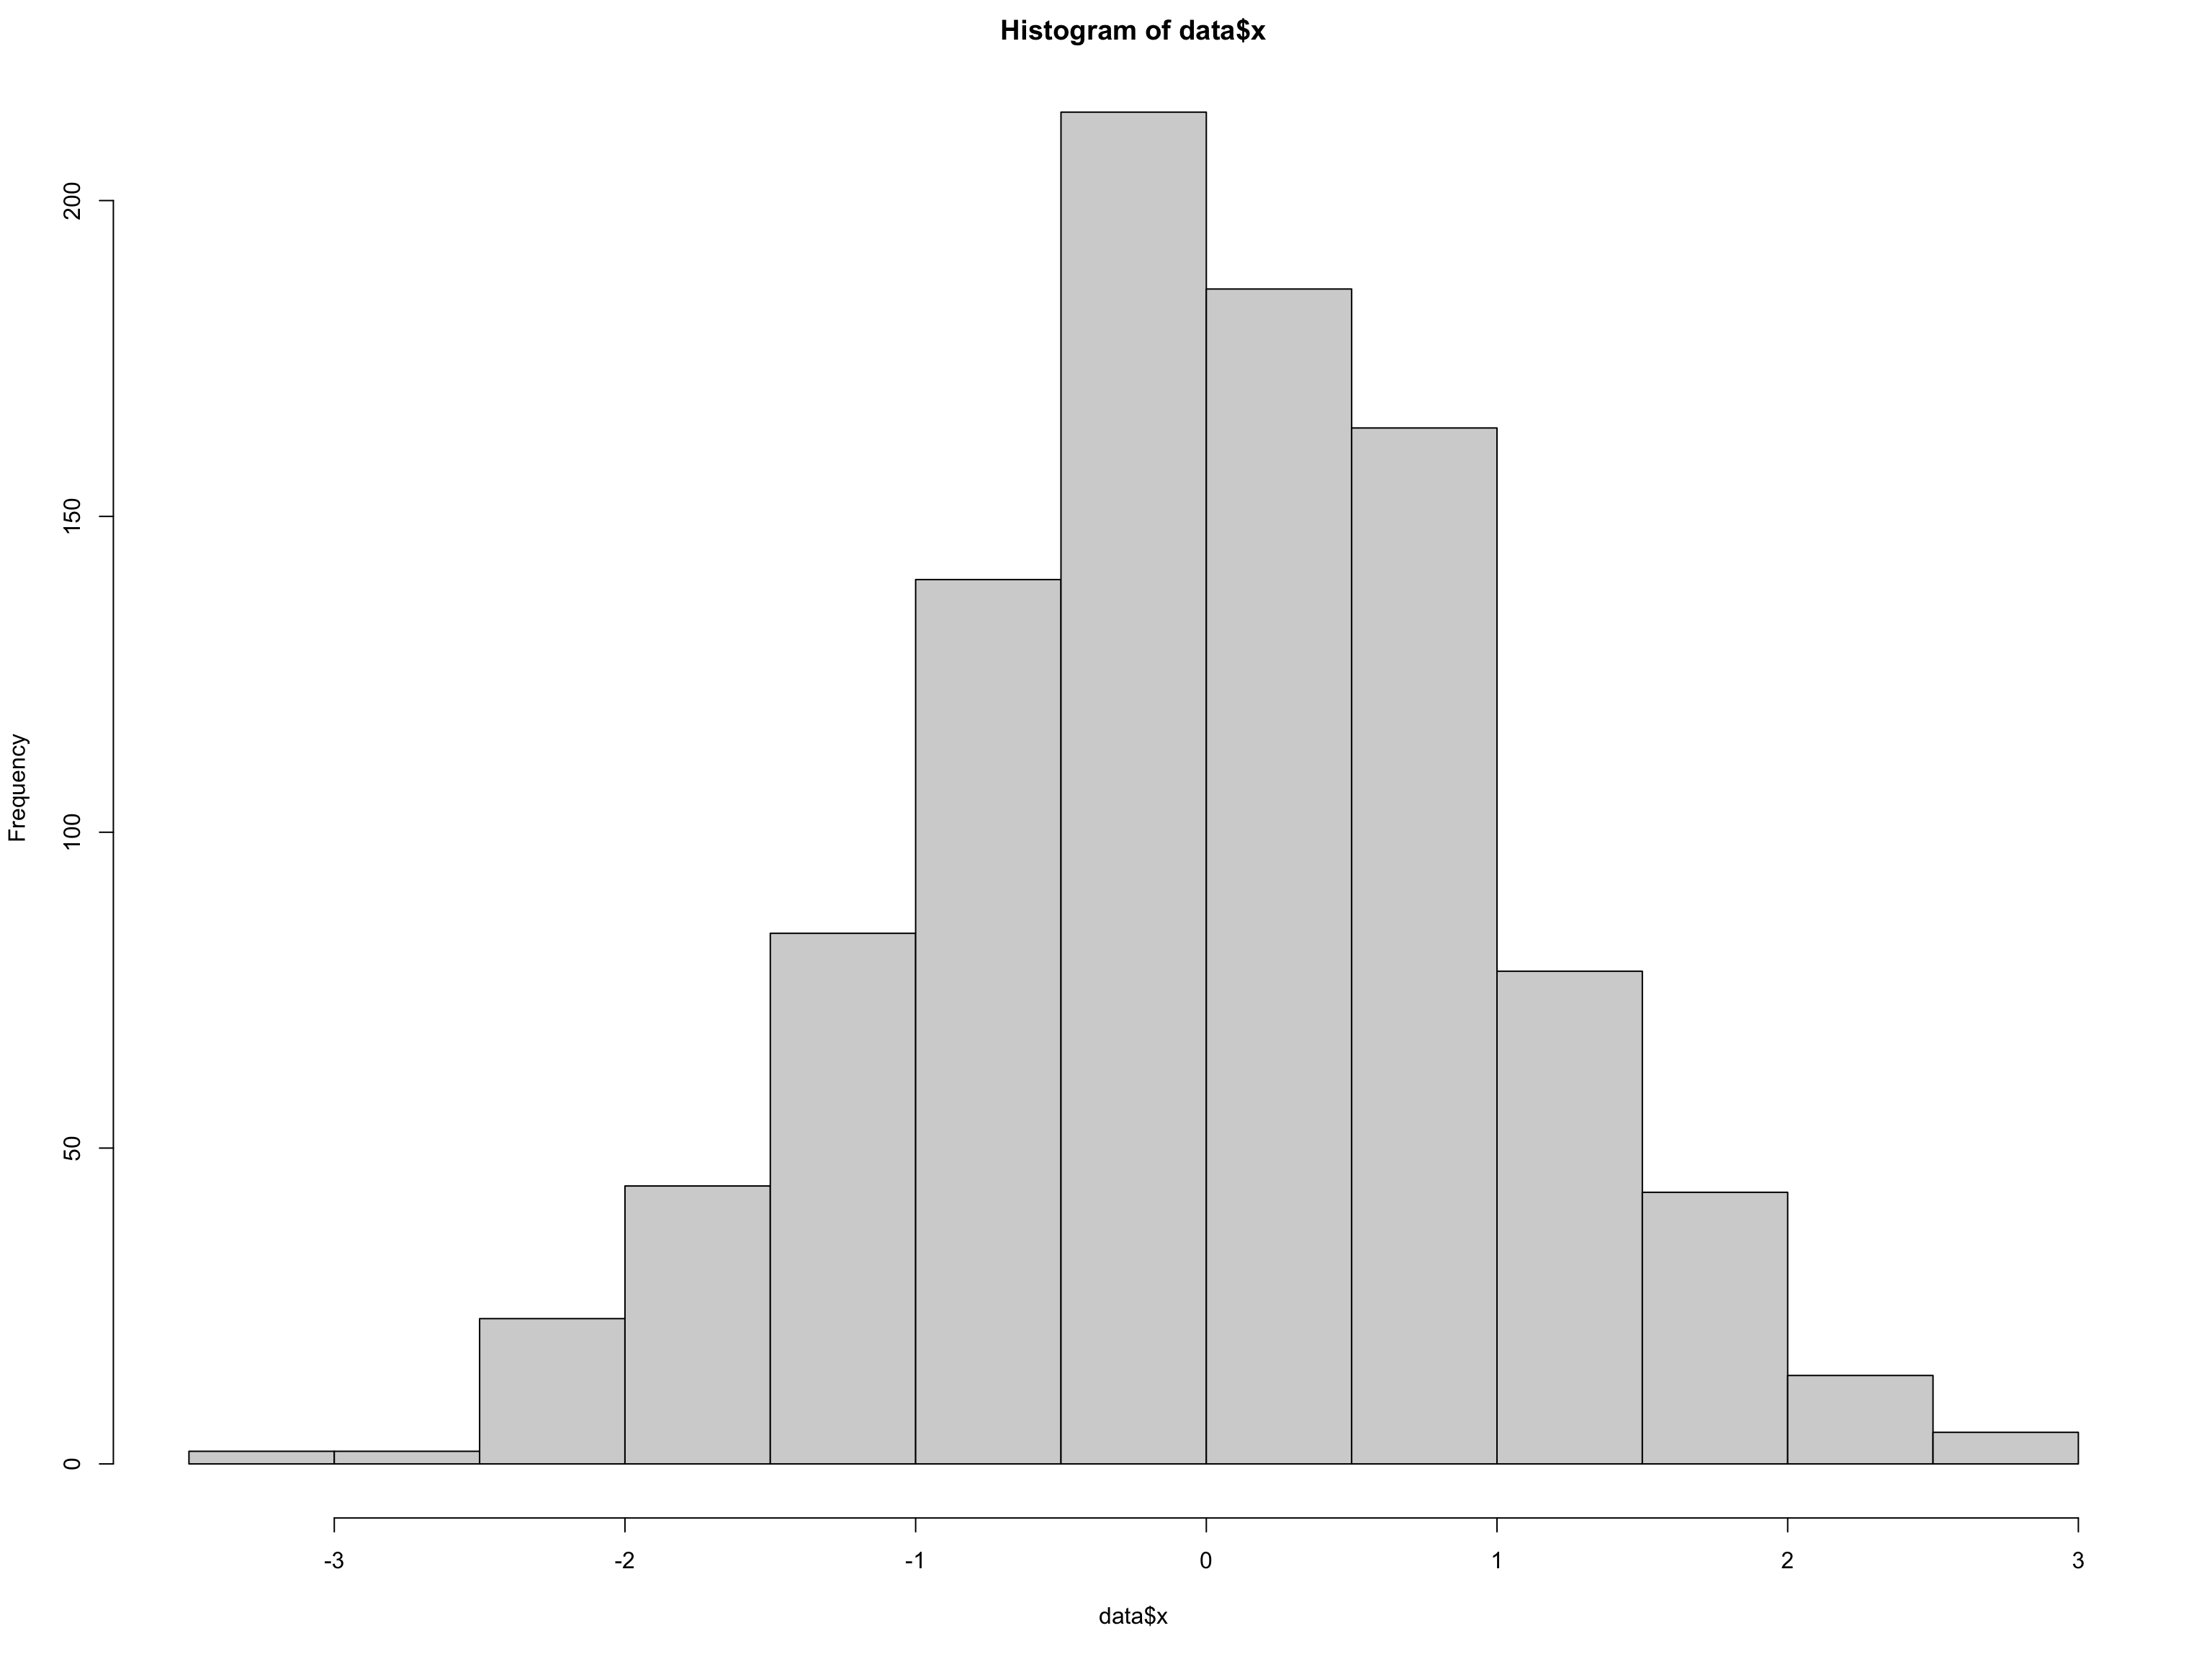
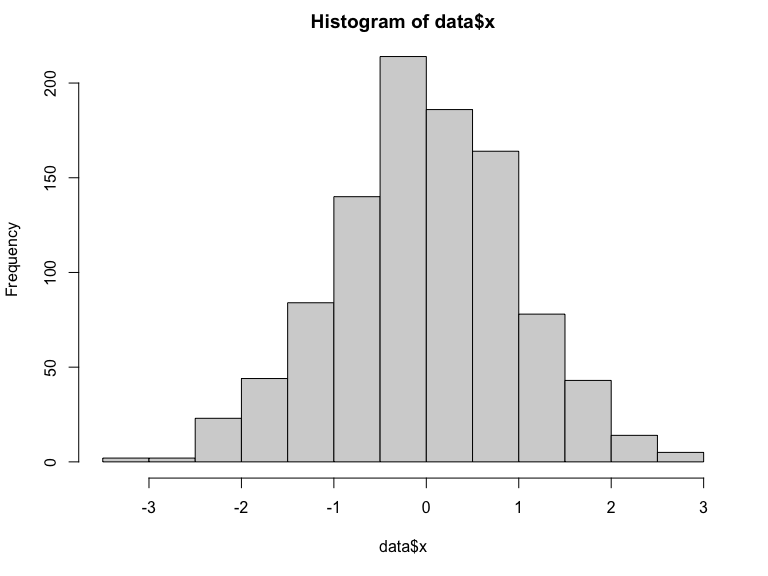
Here are examples of files I am getting with information from magick package:
-
Figure saved from Rmd document after chunk was ran on retina display: 3072x2304 and has small text generated

-
Figure saved from Rmd document after chunk was ran on external monitor: 768x576 text is fine but figure is small

-
Figure saved from knitr generated html document: 1536x1152 text fine

it happens only when figure is generated by running a chunk in Rmd document in RStudio, but not when the code is run from normal document.
Can you clarify this for me ? Do you mean it only happen using the green arrow for running a chunk in RStudio IDE source pane ? By "normal" document you mean R source file ?
Can you share the document you are using ? Which format are you using ?
knitr html output figures are not affected.
You mean that this only happens when running code inside RStudio IDE ? If you run rmarkdown::render() in console, you get the same output every time ?
this issue still happens in RStudio 2021.09.01 Build 372 with R 4.1.2, knitr 1.37, rmarkdown 2.11 on 14'' M1 MacBook pro.
If I understand correctly, this could be link to RStudio IDE. Could you try with last available daily version ? https://dailies.rstudio.com/
What does happen in R console if you generate the file and save them to file ? using ggplot2::ggsave() for example. By the way, what knitr does is using the grDevices::png() device by default to save to file. You could try another device to see if this change anything. like dev = "ragg_png" as knitr option or in the rmarkdown output format.
Is this happening only with ggplot2 graphics ? What happens when saving the file yourself ?
Thanks for you help on this. As I can't reproduce for now, it is hard to look into it myself and I need your help. Thank you!
Correct. It happens only inside IDE when running the chunk with the green arrow or with cmd+Enter and figure is displayed in source pane. It doesn't happen when code is pasted directly into Console and figure is displayed in Viewer tab.
rmarkdown::render() produces normal output.
It happens also with the latest daily version and It's not only with ggplot but also with default R graphics.
Retina:
Monitor:
Code is just what I posted before: R-test.Rmd.zip
Correct. It happens only inside IDE when running the chunk with the green arrow or with cmd+Enter and figure is displayed in source pane. It doesn't happen when code is pasted directly into Console and figure is displayed in Viewer tab.
That is the key information. I believe this is not a rmarkdown issue then but an issue with the RStudio IDE and how images are processed during the (caching?) mechanism to show them inline. It is not using rmarkdown R code but its own R code bundled into the IDE. We'll need to look about that there.
There is possibly a related issue with figures inside Notebook RStudio https://github.com/rstudio/rstudio/issues/4521 Maybe it could be of interest.
I also found https://github.com/rstudio/rstudio/issues/2098 and https://github.com/rstudio/rstudio/issues/7892 which seems to relate about mac retina display.
I may move this issue in the RStudio repo then, or we could try to open new one that summarize the thread. 🤔 Or do you want to open one there with your last example ?
Linking also here the relevant twitter discussion and hack
- https://twitter.com/LisaDeBruine/status/1447956903095644171
- https://gist.github.com/debruine/baa61e561935d5e0df1ea0f294399c6c
shared in https://github.com/rstudio/rstudio/issues/7028#issuecomment-1010917372
There seems to be a similar example posted in rstudio/rstudio#7028. I don't think it needs a new issue if we'd know how to reopen that one, which got autoclosed.